

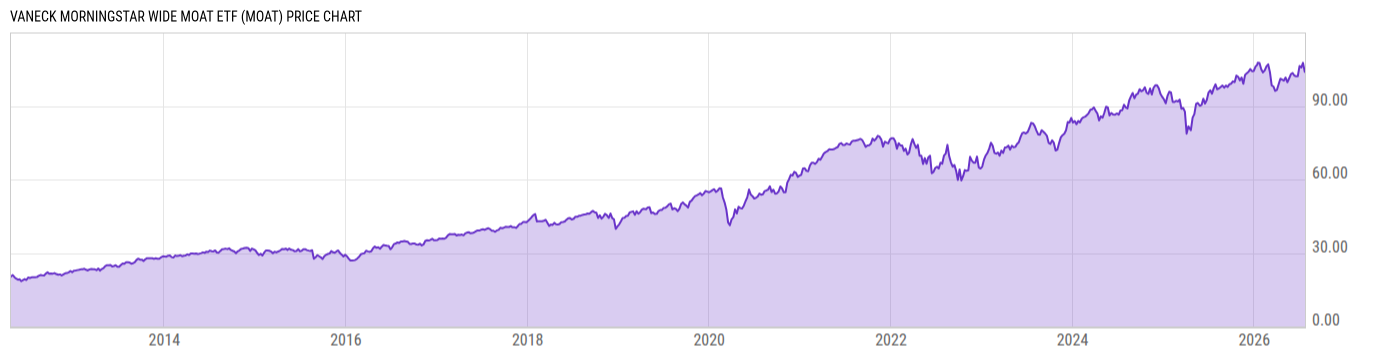
VanEck Morningstar Wide Moat ETF (MOAT)
106.21
+1.58
(+1.51%)
USD |
BATS |
Jul 27, 13:25
Price Chart
Key Stats
| Net Expense Ratio | Discount or Premium to NAV | Total Assets Under Management | 30-Day Average Daily Volume |
|---|---|---|---|
| 0.46% | -0.02% | 11.46B | 729258.8 |
| Weighted Average Dividend Yield | Turnover Ratio (Generic) | 1 Year Fund Level Flows | Max Drawdown (Since Inception) |
| 1.50% | 55.00% | -2.519B |
Basic Info
| Investment Strategy | |
| The Fund seeks to replicate as closely as possible, before fees and expenses, the price and yield performance of the Morningstar Wide Moat Focus Index (MWMFTR). The index is intended to track the overall performance of attractively priced companies with sustainable competitive advantages according to Morningstar's equity research team. The Index is a rules-based, equal-weighted index intended to offer exposure to attractively priced companies with sustainable competitive advantages according to Morningstar's equity research team. |
| General | |
| Security Type | Exchange-Traded Fund |
| Equity Style | Multi Cap Core |
| Broad Asset Class | US Equity |
| Broad Category | Equity |
| Global Peer Group | Equity US |
| Peer Group | Multi-Cap Core Funds |
| Global Macro | Equity North America |
| US Macro | Multi-Cap Funds |
| YCharts Categorization | -- |
| YCharts Benchmark | -- |
| Prospectus Objective | Growth & Income Funds |
| Fund Owner Firm Name | VanEck |
| Broad Asset Class Benchmark Index | |
| ^SPXTR | 100.0% |
Performance Versus Peer Group
Annual Total Returns Versus Peers
As of July 27, 2026.
Asset Allocation
As of June 30, 2026.
| Type | % Net |
|---|---|
| Cash | 0.01% |
| Stock | 99.99% |
| Bond | 0.00% |
| Convertible | 0.00% |
| Preferred | 0.00% |
| Other | 0.00% |
Basic Info
| Investment Strategy | |
| The Fund seeks to replicate as closely as possible, before fees and expenses, the price and yield performance of the Morningstar Wide Moat Focus Index (MWMFTR). The index is intended to track the overall performance of attractively priced companies with sustainable competitive advantages according to Morningstar's equity research team. The Index is a rules-based, equal-weighted index intended to offer exposure to attractively priced companies with sustainable competitive advantages according to Morningstar's equity research team. |
| General | |
| Security Type | Exchange-Traded Fund |
| Equity Style | Multi Cap Core |
| Broad Asset Class | US Equity |
| Broad Category | Equity |
| Global Peer Group | Equity US |
| Peer Group | Multi-Cap Core Funds |
| Global Macro | Equity North America |
| US Macro | Multi-Cap Funds |
| YCharts Categorization | -- |
| YCharts Benchmark | -- |
| Prospectus Objective | Growth & Income Funds |
| Fund Owner Firm Name | VanEck |
| Broad Asset Class Benchmark Index | |
| ^SPXTR | 100.0% |