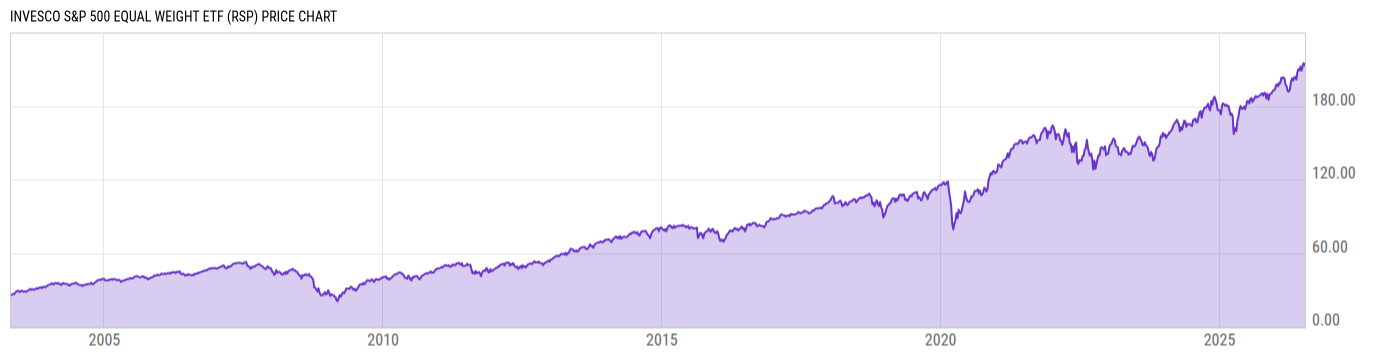
Invesco S&P 500® Equal Weight ETF (RSP)
137.05
+3.04 (+2.27%)
USD |
Mar 05, 16:59
Price Chart
Key Stats
Customize
Expense Ratio | Discount or Premium to NAV | Total Assets Under Management | 30-Day Average Daily Volume |
---|---|---|---|
0.20% | 0.09% | 21.45B | 2.523M |
Dividend Yield | Turnover Ratio | 1 Year Fund Level Flows | Max Drawdown (All) |
1.53% | 19.00% | 2.829B | Upgrade |
Basic Info
Investment Strategy | |
The investment seeks to track the investment results (before fees and expenses) of the S&P 500® Equal Weight Index (the "underlying index"). The fund generally will invest at least 90% of its total assets in the securities that comprise the underlying index. Strictly in accordance with its guidelines and mandated procedures, the index provider compiles, maintains and calculates the underlying index, which is an equal-weighted version of the S&P 500® Index. The fund is non-diversified. |
General | |
Security Type | Exchange-Traded Fund |
Equity Style | Mid Cap/Value |
Fixed Income Style | -- |
Broad Asset Class | US Equity |
Broad Category | Equity |
Category Name | Large Blend |
Category Index | Russell 1000 TR USD |
Prospectus Objective | Growth |
Fund Owner Firm Name | Invesco |
Prospectus Benchmark Index | |
S&P 500 Equal Weighted TR USD | 100.0% |
Broad Asset Class Benchmark Index | |
^SPXTR | 100.0% |
Manager Tenure | |
Michael Jeanette | 2.90 yrs |
Peter Hubbard | 2.90 yrs |
Tony Seisser | 2.90 yrs |
Pratik Doshi | 0.51 yrs |
Net Fund Flows Versus Category
1 Month
% Rank:
--
--
Category Low
--
Category High
1 Year
% Rank:
1
2.829B
-22.48B
Category Low
9.590B
Category High
3 Months
% Rank:
--
--
Category Low
--
Category High
3 Years
% Rank:
--
--
Category Low
--
Category High
6 Months
% Rank:
--
--
Category Low
--
Category High
5 Years
% Rank:
--
--
Category Low
--
Category High
YTD
% Rank:
--
--
Category Low
--
Category High
10 Years
% Rank:
--
--
Category Low
--
Category High
As of February 28, 2021
Performance Versus Category
As of March 04, 2021. Returns for periods of 1 year and above are annualized.
Annual Total Returns Versus Peers
Edit comparables
As of March 04, 2021.
Asset Allocation
Top 10 Holdings
Name | % Weight | Price | % Change |
---|---|---|---|
ViacomCBS Inc Class B | 0.37% | 74.22 | 3.26% |
Marathon Oil Corp | 0.30% | 12.99 | 5.10% |
Diamondback Energy Inc | 0.27% | 85.27 | 4.93% |
SVB Financial Group | 0.27% | 507.89 | 1.07% |
Freeport-McMoRan Inc | 0.26% | 35.00 | 7.03% |
The Mosaic Co | 0.26% | 30.07 | 1.69% |
HollyFrontier Corp | 0.26% | 39.97 | 2.51% |
Tapestry Inc | 0.26% | 41.89 | 2.75% |
People's United Financial Inc | 0.26% | 18.40 | 2.85% |
Devon Energy Corp | 0.26% | 25.62 | 8.47% |
News
Headline
Wire
Time (ET)
SA Breaking News
12/15 13:27
SA Breaking News
08/01 18:21
SA Breaking News
08/01 18:21
Basic Info
Investment Strategy | |
The investment seeks to track the investment results (before fees and expenses) of the S&P 500® Equal Weight Index (the "underlying index"). The fund generally will invest at least 90% of its total assets in the securities that comprise the underlying index. Strictly in accordance with its guidelines and mandated procedures, the index provider compiles, maintains and calculates the underlying index, which is an equal-weighted version of the S&P 500® Index. The fund is non-diversified. |
General | |
Security Type | Exchange-Traded Fund |
Equity Style | Mid Cap/Value |
Fixed Income Style | -- |
Broad Asset Class | US Equity |
Broad Category | Equity |
Category Name | Large Blend |
Category Index | Russell 1000 TR USD |
Prospectus Objective | Growth |
Fund Owner Firm Name | Invesco |
Prospectus Benchmark Index | |
S&P 500 Equal Weighted TR USD | 100.0% |
Broad Asset Class Benchmark Index | |
^SPXTR | 100.0% |
Manager Tenure | |
Michael Jeanette | 2.90 yrs |
Peter Hubbard | 2.90 yrs |
Tony Seisser | 2.90 yrs |
Pratik Doshi | 0.51 yrs |
Fundamentals
General | |
Distribution Yield | Upgrade |
Dividend Yield TTM (3-5-21) | 1.53% |
30-Day SEC Yield (1-31-21) | Upgrade |
7-Day SEC Yield | -- |
Number of Holdings | Upgrade |
Stock | |
Weighted Average PE Ratio | 23.42 |
Weighted Average Price to Sales Ratio | Upgrade |
Weighted Average Price to Book Ratio | Upgrade |
Weighted Median ROE | Upgrade |
Weighted Median ROA | Upgrade |
Forecasted Dividend Yield | Upgrade |
Forecasted PE Ratio | Upgrade |
Forecasted Price to Sales Ratio | Upgrade |
Forecasted Price to Book Ratio | Upgrade |
As of March 05, 2021
Growth Estimates
Fund Details
Key Dates | |
Inception Date | 4/24/2003 |
Last Annual Report Date | 4/30/2020 |
Last Prospectus Date | 8/28/2020 |
Attributes | |
Enhanced Index Fund | No |
Index Fund |
|
Inverse Fund | No |
Leveraged Fund | No |
Fund of Funds | No |
Currency Hedged Fund | No |
Synthetic Replication Fund | No |
Has Dividend Investment Plan |
|
Socially Responsible Fund | No |
News
Headline
Wire
Time (ET)
SA Breaking News
12/15 13:27
SA Breaking News
08/01 18:21
SA Breaking News
08/01 18:21