

US Personal Saving Rate (I:USPSR)
3.00% for May 2026
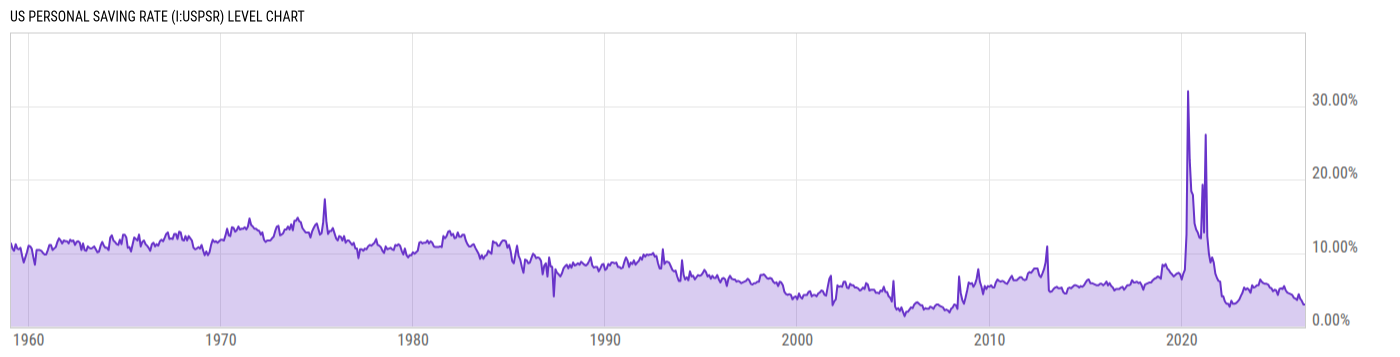
Level Chart
Basic Info
|
US Personal Saving Rate is at 3.00%, compared to 3.00% last month and 4.90% last year. This is lower than the long term average of 8.36%. |
| Report | Personal Income and Outlays |
| Category | Consumer & Household Statistics |
| Region | United States |
| Source | Bureau of Economic Analysis |
Stats
| Last Value | 3.00% |
| Latest Period | May 2026 |
| Last Updated | Jun 25 2026, 08:34 EDT |
| Next Release | Jul 30 2026, 08:30 EDT |
| Long Term Average | 8.36% |
| Average Growth Rate | 7.83% |
| Value from Last Month | 3.00% |
| Change from Last Month | 0.00% |
| Value from 1 Year Ago | 4.90% |
| Change from 1 Year Ago | -38.78% |
| Frequency | Monthly |
| Unit | Percent of Disposable Personal Income |
| Adjustment | Seasonally Adjusted Annual Rate |
| Download Source File | |
| Notes | U.S personal saving rate. |
Historical Data
| Date | Value |
|---|---|
| May 31, 2026 | 3.00% |
| April 30, 2026 | 3.00% |
| March 31, 2026 | 3.50% |
| February 28, 2026 | 3.80% |
| January 31, 2026 | 4.40% |
| December 31, 2025 | 3.60% |
| November 30, 2025 | 3.80% |
| October 31, 2025 | 3.90% |
| September 30, 2025 | 4.30% |
| August 31, 2025 | 4.40% |
| July 31, 2025 | 4.50% |
| June 30, 2025 | 4.60% |
| May 31, 2025 | 4.90% |
| April 30, 2025 | 5.50% |
| March 31, 2025 | 5.10% |
| February 28, 2025 | 5.20% |
| January 31, 2025 | 5.10% |
| December 31, 2024 | 4.30% |
| November 30, 2024 | 4.90% |
| October 31, 2024 | 5.00% |
| September 30, 2024 | 4.80% |
| August 31, 2024 | 5.20% |
| July 31, 2024 | 5.30% |
| June 30, 2024 | 5.70% |
| May 31, 2024 | 5.80% |
| Date | Value |
|---|---|
| April 30, 2024 | 5.80% |
| March 31, 2024 | 5.90% |
| February 29, 2024 | 6.10% |
| January 31, 2024 | 6.40% |
| December 31, 2023 | 5.60% |
| November 30, 2023 | 5.60% |
| October 31, 2023 | 5.40% |
| September 30, 2023 | 5.30% |
| August 31, 2023 | 5.60% |
| July 31, 2023 | 4.60% |
| June 30, 2023 | 5.00% |
| May 31, 2023 | 5.20% |
| April 30, 2023 | 5.00% |
| March 31, 2023 | 5.30% |
| February 28, 2023 | 4.60% |
| January 31, 2023 | 4.20% |
| December 31, 2022 | 3.70% |
| November 30, 2022 | 3.40% |
| October 31, 2022 | 3.20% |
| September 30, 2022 | 3.10% |
| August 31, 2022 | 3.10% |
| July 31, 2022 | 3.50% |
| June 30, 2022 | 2.70% |
| May 31, 2022 | 3.10% |
| April 30, 2022 | 3.10% |
News
Headline
Time (ET)
07/13 16:25
07/02 16:13
07/02 12:18
06/23 12:02
06/16 06:53
Basic Info
|
US Personal Saving Rate is at 3.00%, compared to 3.00% last month and 4.90% last year. This is lower than the long term average of 8.36%. |
| Report | Personal Income and Outlays |
| Category | Consumer & Household Statistics |
| Region | United States |
| Source | Bureau of Economic Analysis |
Stats
| Last Value | 3.00% |
| Latest Period | May 2026 |
| Last Updated | Jun 25 2026, 08:34 EDT |
| Next Release | Jul 30 2026, 08:30 EDT |
| Long Term Average | 8.36% |
| Average Growth Rate | 7.83% |
| Value from Last Month | 3.00% |
| Change from Last Month | 0.00% |
| Value from 1 Year Ago | 4.90% |
| Change from 1 Year Ago | -38.78% |
| Frequency | Monthly |
| Unit | Percent of Disposable Personal Income |
| Adjustment | Seasonally Adjusted Annual Rate |
| Download Source File | |
| Notes | U.S personal saving rate. |