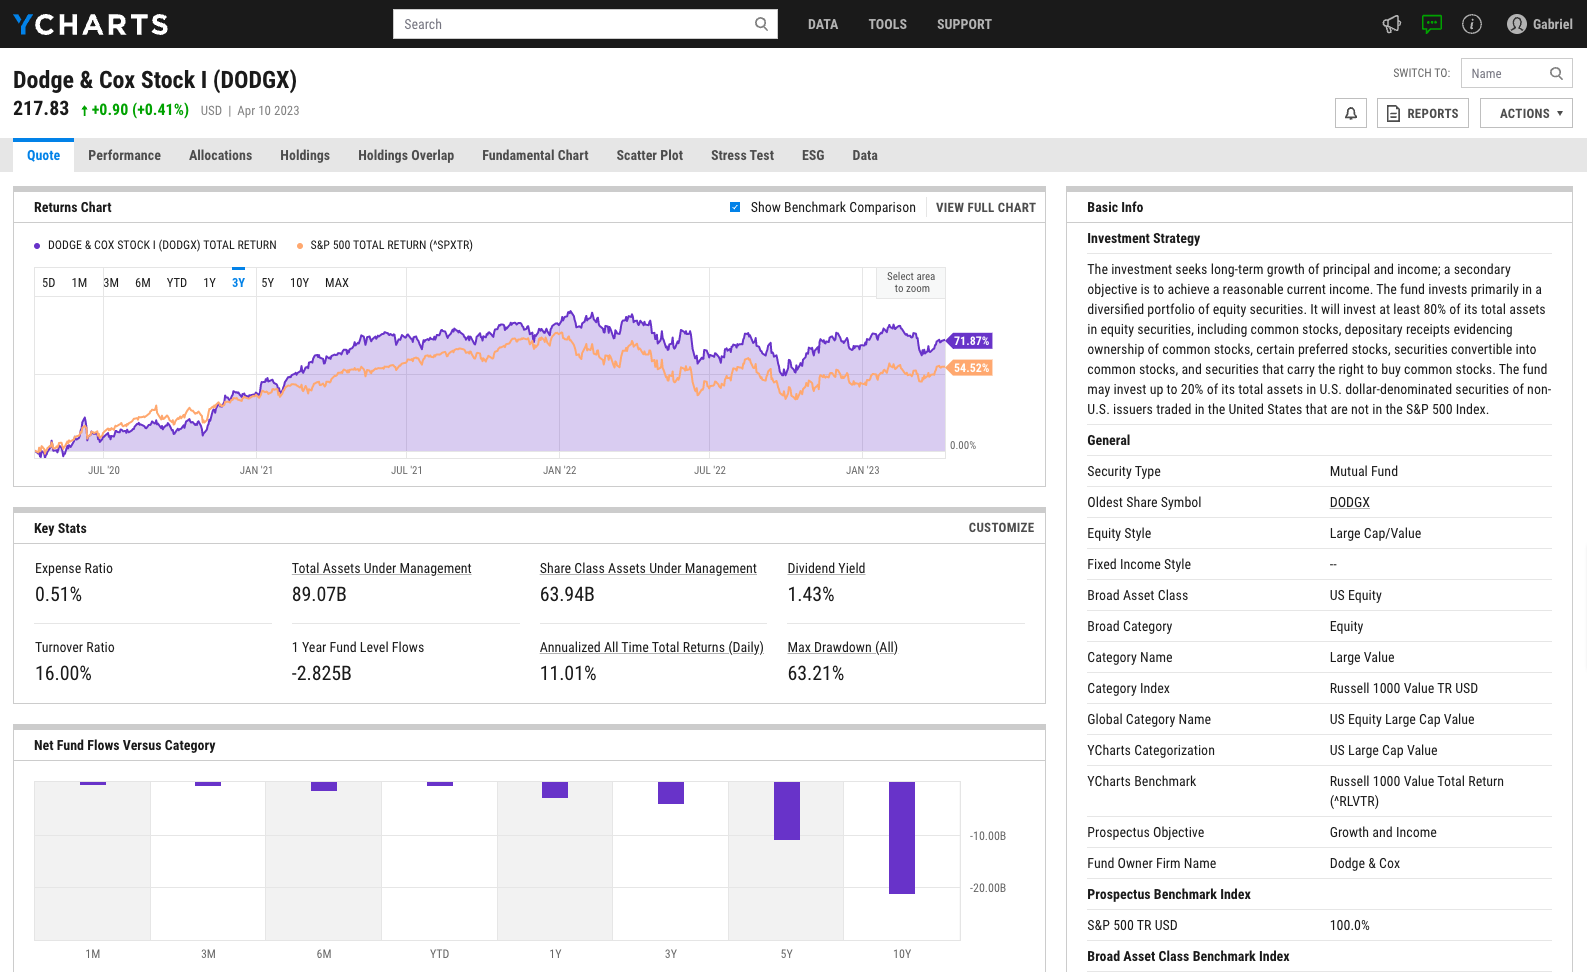
Returns Chart

Sun Life MFS Low Vol International Equity Sr T8 (SUN1208) Total Return
Created with Highcharts 11.1.0Oct '24Jan '25Apr '25Jul '250.00%20.28%

Key Stats

Customize
Net Expense Ratio Total Assets Under Management Weighted Average Dividend Yield Turnover Ratio (Generic)
2.19% 26.57M 3.09% 23.07%
1 Year Fund Level Flows 1 Year Total Returns (Daily) Annualized Total Returns Since Inception (Daily) Max Drawdown (Since Inception)
16.22M 21.46% Upgrade Upgrade

Basic Info

Investment Strategy
The Fund's investment objective is to seek long-term capital appreciation with low volatility by investing primarily in a diversified portfolio of equity securities of issuers outside Canada and the United States or indirectly by investing in mutual funds (including exchange-traded funds) that primarily invest in such securities. This Fund may be suitable for investors who seek to add international geographic diversification with a focus towards lowering portfolio volatility, are long-term investors, and are comfortable with medium investment risk.
General
Security Type Mutual Fund
Broad Asset Class International Equity
Broad Category Equity
Global Peer Group Equity Global ex US
Peer Group International Equity
Global Macro Equity Global
US Macro --
YCharts Categorization --
YCharts Benchmark --
Prospectus Objective --
Fund Owner Firm Name Sun Life
Broad Asset Class Benchmark Index
^SPTSX60TR 100.0%

View Basic Info
Start Trial

Net Fund Flows Versus Peer Group

View Net Fund Flows. Upgrade now.
1M
3M
6M
YTD
1Y
3Y
5Y
10Y
 
80.00B
60.00B
40.00B
20.00B
0
-20.00B
1 Month
% Rank: 25
-459.03M Peer Group Low
514.34M Peer Group High
1 Year
% Rank: 33
16.22M
-1.553B Peer Group Low
3.043B Peer Group High
3 Months
% Rank: 27
-978.42M Peer Group Low
1.274B Peer Group High
3 Years
% Rank: 31
-2.853B Peer Group Low
4.732B Peer Group High
6 Months
% Rank: 30
-1.508B Peer Group Low
2.239B Peer Group High
5 Years
% Rank: 34
-1.990B Peer Group Low
6.500B Peer Group High
YTD
% Rank: 29
-1.508B Peer Group Low
2.239B Peer Group High
10 Years
% Rank: 42
-1.535B Peer Group Low
9.228B Peer Group High
Date Unavailable

Performance Versus Peer Group

 
20%
15%
10%
5%
0
Name
1M
3M
YTD
1Y
3Y
5Y
10Y
15Y
Total Return (NAV)
12.00%
12.00%
12.00%
12.00%
12.00%
12.00%
12.00%
12.00%
Peer Group Rtn. (NAV)
12.00%
12.00%
12.00%
12.00%
12.00%
12.00%
12.00%
12.00%
% Rank in Peer Group (NAV)
5.0
5.0
5.0
5.0
5.0
5.0
5.0
5.0
View Performance Versus Peer Group
Start Trial

Annual Total Returns Versus Peers

There are no valid items on this chart.

Name
2018
2019
2020
2021
2022
2023
2024
YTD
-1.72%
10.89%
-0.35%
7.49%
-6.37%
8.82%
14.02%
18.78%
-7.58%
21.93%
5.56%
28.04%
-6.24%
12.05%
21.04%
12.17%
-8.61%
17.86%
3.20%
10.31%
-12.63%
12.50%
11.78%
15.66%
--
18.64%
16.68%
8.47%
-19.75%
13.76%
16.03%
16.19%
--
12.24%
0.58%
12.23%
-6.90%
13.95%
12.41%
15.88%
--
--
--
--
--
--
--
15.03%
As of July 27, 2025.

Fundamentals

General
Distribution Yield --
Dividend Yield TTM (7-25-25) 6.80%
30-Day SEC Yield --
7-Day SEC Yield --
Stock
Weighted Average PE Ratio 22.17
Weighted Average Price to Sales Ratio 2.582
Weighted Average Price to Book Ratio 4.104
Weighted Median ROE 17.97%
Weighted Median ROA 5.64%
ROI (TTM) 10.16%
Return on Investment (TTM) 10.16%
Earning Yield 0.0580
LT Debt / Shareholders Equity 0.7617
As of May 31, 2025

Growth Metrics

EPS Growth (1Y) 9.11%
EPS Growth (3Y) 8.81%
EPS Growth (5Y) 12.70%
Sales Growth (1Y) 4.82%
Sales Growth (3Y) 6.47%
Sales Growth (5Y) 5.11%
Sales per Share Growth (1Y) 6.12%
Sales per Share Growth (3Y) 7.25%
Operating Cash Flow - Growth Ratge (3Y) 8.13%
As of May 31, 2025

Asset Allocation

Created with Highcharts 11.1.0
As of May 31, 2025.
Type % Net
Cash -0.62%
Stock 98.71%
Bond 1.91%
Convertible 0.00%
Preferred 0.00%
Other 0.00%
View Asset Allocation
Start Trial

Top 10 Holdings

Created with Highcharts 11.1.0
Name % Weight Price % Change
DBS Group Holdings Ltd 2.87% 36.16 -5.98%
Koninklijke KPN NV 2.78% 4.70 -1.05%
Eni SpA 2.76% 18.24 10.88%
Roche Holding AG 2.70% 330.52 -1.03%
Wolters Kluwer NV 2.63% 160.47 1.63%
Singapore Technologies Engineering Ltd 2.57% 6.91 7.46%
CLP Holdings Ltd 2.42% 7.90 0.00%
Viscofan SA 2.39% 64.85 0.00%
Zurich Insurance Group AG 2.27% 716.60 -0.31%
Sanofi SA 2.24% 101.40 4.11%

Fees & Availability

Fees
Actual 12B-1 Fee --
Actual Management Fee --
Administration Fee --
Maximum Front Load --
Maximum Deferred Load --
Maximum Redemption Fee --
General Availability
Available for Insurance Product --
Available for RRSP Yes
Purchase Details
Open to New Investors Yes
Minimum Initial Investment 500.00 None
Minimum Subsequent Investment 50.00 None

Basic Info

Investment Strategy
The Fund's investment objective is to seek long-term capital appreciation with low volatility by investing primarily in a diversified portfolio of equity securities of issuers outside Canada and the United States or indirectly by investing in mutual funds (including exchange-traded funds) that primarily invest in such securities. This Fund may be suitable for investors who seek to add international geographic diversification with a focus towards lowering portfolio volatility, are long-term investors, and are comfortable with medium investment risk.
General
Security Type Mutual Fund
Broad Asset Class International Equity
Broad Category Equity
Global Peer Group Equity Global ex US
Peer Group International Equity
Global Macro Equity Global
US Macro --
YCharts Categorization --
YCharts Benchmark --
Prospectus Objective --
Fund Owner Firm Name Sun Life
Broad Asset Class Benchmark Index
^SPTSX60TR 100.0%

View Basic Info
Start Trial

Fundamentals

General
Distribution Yield --
Dividend Yield TTM (7-25-25) 6.80%
30-Day SEC Yield --
7-Day SEC Yield --
Stock
Weighted Average PE Ratio 22.17
Weighted Average Price to Sales Ratio 2.582
Weighted Average Price to Book Ratio 4.104
Weighted Median ROE 17.97%
Weighted Median ROA 5.64%
ROI (TTM) 10.16%
Return on Investment (TTM) 10.16%
Earning Yield 0.0580
LT Debt / Shareholders Equity 0.7617
As of May 31, 2025

Growth Metrics

EPS Growth (1Y) 9.11%
EPS Growth (3Y) 8.81%
EPS Growth (5Y) 12.70%
Sales Growth (1Y) 4.82%
Sales Growth (3Y) 6.47%
Sales Growth (5Y) 5.11%
Sales per Share Growth (1Y) 6.12%
Sales per Share Growth (3Y) 7.25%
Operating Cash Flow - Growth Ratge (3Y) 8.13%
As of May 31, 2025

Fund Details

Key Dates
Inception Date --
Last Annual Report Date 12/31/2024
Last Prospectus Date --
Share Classes
SUN1206 Commission-based Advice
SUN1207 Commission-based Advice
SUN1406 Fee-based Advice
SUN51403 Fee-based Advice
Attributes
Index Fund --
Inverse Fund --
Leveraged Fund --
Fund of Funds No
Currency Hedged Fund --
Synthetic Replication Fund No

Top Portfolio Holders

Name % Weight
Portfolio A 5.00%
Portfolio B 3.50%
Portfolio C 2.25%
View Top Portfolio Holders
Start Trial

Excel Add-In Codes

Name: =YCI("M:SUN1208.TO", "name")
Broad Asset Class: =YCI("M:SUN1208.TO", "broad_asset_class")
Broad Category: =YCI("M:SUN1208.TO", "broad_category_group")
Prospectus Objective: =YCI("M:SUN1208.TO", "prospectus_objective")
To find the codes for any of our securities and financial metrics, see our Complete Excel Reference.
View Excel Add-In Codes
Start Trial
Quickflows