

S&P 500 1 Year Return (DISCONTINUED) (I:SP5001YR)
Level Chart
Basic Info
|
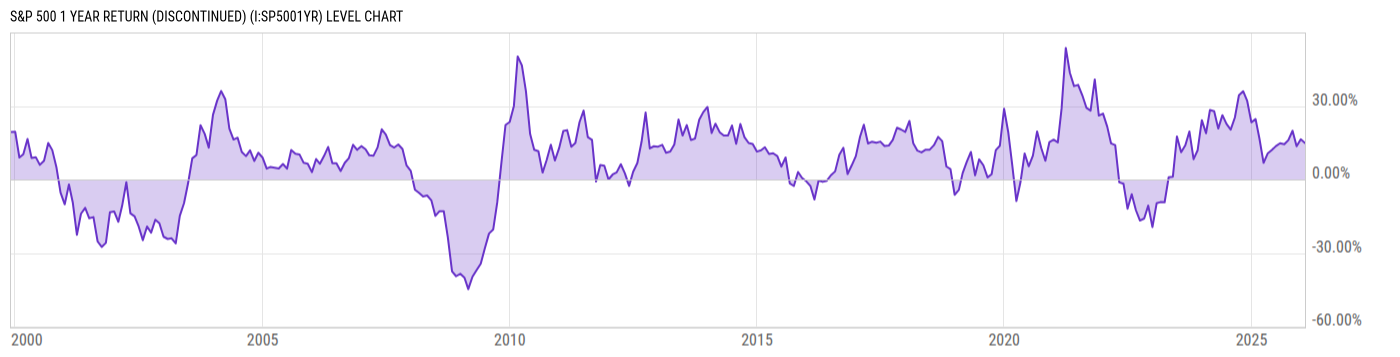
S&P 500 1 Year Return is at 14.87%, compared to 16.39% last month and 24.66% last year. This is higher than the long term average of 7.61%. |
|
The S&P 500 1 Year Return is the investment return received for a 1 year period, excluding dividends, when holding the S&P 500 index. The S&P 500 index is a basket of 500 large US stocks, weighted by market cap, and is the most widely followed index representing the US stock market. |
| Report | S&P 500 Returns |
| Category | Market Indices and Statistics |
| Region | United States |
| Source | Standard and Poor's |
Stats
| Last Value | 14.87% |
| Latest Period | Jan 2026 |
| Last Updated | Feb 5 2026, 11:02 EST |
| Long Term Average | 7.61% |
| Average Growth Rate | -3.08K% |
| Value from Last Month | 16.39% |
| Change from Last Month | -9.23% |
| Value from 1 Year Ago | 24.66% |
| Change from 1 Year Ago | -39.68% |
| Frequency | Monthly |
| Unit | Percent |
| Adjustment | N/A |
| Download Source File |
Historical Data
| Date | Value |
|---|---|
| January 31, 2026 | 14.87% |
| December 31, 2025 | 16.39% |
| November 30, 2025 | 13.54% |
| October 31, 2025 | 19.89% |
| September 30, 2025 | 16.07% |
| August 31, 2025 | 14.37% |
| July 31, 2025 | 14.80% |
| June 30, 2025 | 13.63% |
| May 31, 2025 | 12.02% |
| April 30, 2025 | 10.59% |
| March 31, 2025 | 6.80% |
| February 28, 2025 | 16.84% |
| January 31, 2025 | 24.66% |
| December 31, 2024 | 23.31% |
| November 30, 2024 | 32.06% |
| October 31, 2024 | 36.04% |
| September 30, 2024 | 34.38% |
| August 31, 2024 | 25.31% |
| July 31, 2024 | 20.34% |
| June 30, 2024 | 22.70% |
| May 31, 2024 | 26.26% |
| April 30, 2024 | 20.78% |
| March 31, 2024 | 27.86% |
| February 29, 2024 | 28.36% |
| January 31, 2024 | 18.86% |
| Date | Value |
|---|---|
| December 31, 2023 | 24.23% |
| November 30, 2023 | 11.95% |
| October 31, 2023 | 8.31% |
| September 30, 2023 | 19.59% |
| August 31, 2023 | 13.97% |
| July 31, 2023 | 11.11% |
| June 30, 2023 | 17.57% |
| May 31, 2023 | 1.15% |
| April 30, 2023 | 0.91% |
| March 31, 2023 | -9.30% |
| February 28, 2023 | -9.23% |
| January 31, 2023 | -9.72% |
| December 31, 2022 | -19.44% |
| November 30, 2022 | -10.66% |
| October 31, 2022 | -15.92% |
| September 30, 2022 | -16.76% |
| August 31, 2022 | -12.55% |
| July 31, 2022 | -6.03% |
| June 30, 2022 | -11.92% |
| May 31, 2022 | -1.71% |
| April 30, 2022 | -1.18% |
| March 31, 2022 | 14.03% |
| February 28, 2022 | 14.77% |
| January 31, 2022 | 21.57% |
| December 31, 2021 | 26.89% |
News
Basic Info
|
S&P 500 1 Year Return is at 14.87%, compared to 16.39% last month and 24.66% last year. This is higher than the long term average of 7.61%. |
|
The S&P 500 1 Year Return is the investment return received for a 1 year period, excluding dividends, when holding the S&P 500 index. The S&P 500 index is a basket of 500 large US stocks, weighted by market cap, and is the most widely followed index representing the US stock market. |
| Report | S&P 500 Returns |
| Category | Market Indices and Statistics |
| Region | United States |
| Source | Standard and Poor's |
Stats
| Last Value | 14.87% |
| Latest Period | Jan 2026 |
| Last Updated | Feb 5 2026, 11:02 EST |
| Long Term Average | 7.61% |
| Average Growth Rate | -3.08K% |
| Value from Last Month | 16.39% |
| Change from Last Month | -9.23% |
| Value from 1 Year Ago | 24.66% |
| Change from 1 Year Ago | -39.68% |
| Frequency | Monthly |
| Unit | Percent |
| Adjustment | N/A |
| Download Source File |
Related Indicators
| S&P 500 Fundamentals |
| S&P 500 Dividend Yield (DISCONTINUED) | 1.15% |
| S&P 500 Earnings Yield (DISCONTINUED) | 3.50% |
| S&P 500 Market Cap (DISCONTINUED) | 58.44T USD |
| S&P 500 P/E Ratio (DISCONTINUED) | 28.58 |
| S&P 500 Price to Book Ratio (DISCONTINUED) | 5.265 |
| S&P 500 Shiller CAPE Ratio | 41.37 |
| SPX Put/Call Ratio | 1.18 |
| VIX | 17.09 |
| S&P 500 Returns |
| US Markets |
| S&P 500 | 7503.85 USD |
| S&P 500 Monthly Total Return (DISCONTINUED) | 1.37% |
| S&P 500 P/E Ratio (DISCONTINUED) | 28.58 |
| VIX | 17.09 |
| VIX Put/Call Ratio | 0.35 |
| Wilshire 5000 Price Index (DISCONTINUED) | 52875.49 USD |