

S&P 500 Shiller CAPE Ratio (I:SP500CAP)
Level Chart
Basic Info
|
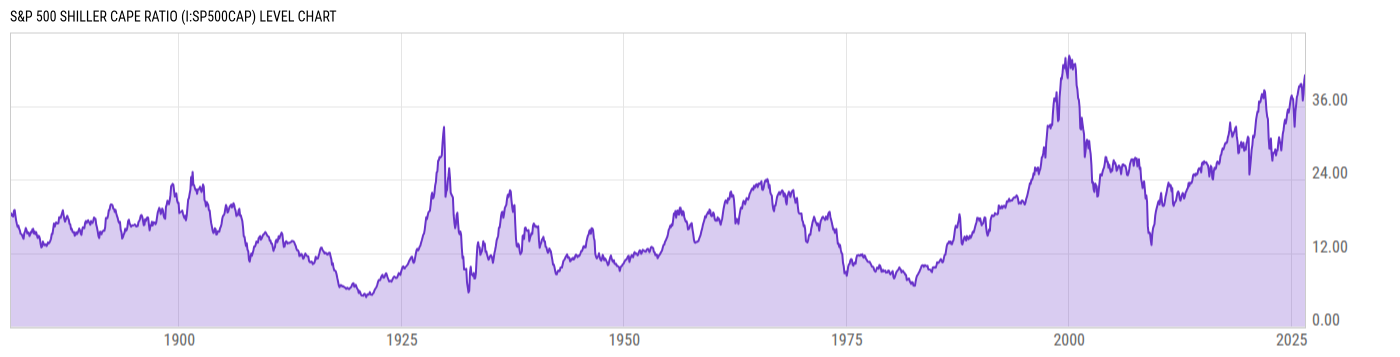
S&P 500 Shiller CAPE Ratio is at a current level of 41.37, up from 40.91 last month and up from 37.47 one year ago. This is a change of 1.13% from last month and 10.39% from one year ago. |
|
The S&P 500 Shiller CAPE Ratio, also known as the Cyclically Adjusted Price-Earnings ratio, is defined as the ratio the the S&P 500's current price divided by the 10-year moving average of inflation-adjusted earnings. The metric was invented by American economist Robert Shiller and has become a popular way to understand long-term stock market valuations. It is used as a valuation metric to forecast future returns, where a higher CAPE ratio could reflect lower returns over the next couple of decades, whereas a lower CAPE ratio could reflect higher returns over the next couple of decades, as the ratio reverts back to the mean. |
| Report | Shiller S&P 500 PE 10 |
| Category | Market Indices and Statistics |
| Region | United States |
| Source | Robert Shiller |
Stats
| Last Value | 41.37 |
| Latest Period | Jul 2026 |
| Last Updated | Jul 8 2026, 19:05 EDT |
| Next Release | Aug 8 2026, 19:00 EDT (E) |
| Average Growth Rate | 1.58% |
| Value from Last Month | 40.91 |
| Change from Last Month | 1.13% |
| Value from 1 Year Ago | 37.47 |
| Change from 1 Year Ago | 10.39% |
| Frequency | Monthly |
| Adjustment | N/A |
| Download Source File |
Historical Data
| Date | Value |
|---|---|
| July 31, 2026 | 41.37 |
| June 30, 2026 | 40.91 |
| May 31, 2026 | 40.60 |
| April 30, 2026 | 38.14 |
| March 31, 2026 | 37.03 |
| February 28, 2026 | 39.01 |
| January 31, 2026 | 39.64 |
| December 31, 2025 | 39.58 |
| November 30, 2025 | 39.15 |
| October 31, 2025 | 39.21 |
| September 30, 2025 | 38.58 |
| August 31, 2025 | 37.85 |
| July 31, 2025 | 37.47 |
| June 30, 2025 | 36.11 |
| May 31, 2025 | 35.08 |
| April 30, 2025 | 32.62 |
| March 31, 2025 | 34.78 |
| February 28, 2025 | 37.19 |
| January 31, 2025 | 37.13 |
| December 31, 2024 | 37.71 |
| November 30, 2024 | 37.35 |
| October 31, 2024 | 36.59 |
| September 30, 2024 | 35.66 |
| August 31, 2024 | 34.92 |
| July 31, 2024 | 35.44 |
| Date | Value |
|---|---|
| June 30, 2024 | 34.81 |
| May 31, 2024 | 33.77 |
| April 30, 2024 | 33.14 |
| March 31, 2024 | 33.75 |
| February 29, 2024 | 33.04 |
| January 31, 2024 | 32.05 |
| December 31, 2023 | 31.45 |
| November 30, 2023 | 30.01 |
| October 31, 2023 | 28.77 |
| September 30, 2023 | 29.80 |
| August 31, 2023 | 30.30 |
| July 31, 2023 | 30.89 |
| June 30, 2023 | 29.94 |
| May 31, 2023 | 28.76 |
| April 30, 2023 | 28.76 |
| March 31, 2023 | 27.94 |
| February 28, 2023 | 28.92 |
| January 31, 2023 | 28.33 |
| December 31, 2022 | 28.32 |
| November 30, 2022 | 28.38 |
| October 31, 2022 | 27.08 |
| September 30, 2022 | 28.23 |
| August 31, 2022 | 30.70 |
| July 31, 2022 | 29.00 |
| June 30, 2022 | 29.05 |
News
Basic Info
|
S&P 500 Shiller CAPE Ratio is at a current level of 41.37, up from 40.91 last month and up from 37.47 one year ago. This is a change of 1.13% from last month and 10.39% from one year ago. |
|
The S&P 500 Shiller CAPE Ratio, also known as the Cyclically Adjusted Price-Earnings ratio, is defined as the ratio the the S&P 500's current price divided by the 10-year moving average of inflation-adjusted earnings. The metric was invented by American economist Robert Shiller and has become a popular way to understand long-term stock market valuations. It is used as a valuation metric to forecast future returns, where a higher CAPE ratio could reflect lower returns over the next couple of decades, whereas a lower CAPE ratio could reflect higher returns over the next couple of decades, as the ratio reverts back to the mean. |
| Report | Shiller S&P 500 PE 10 |
| Category | Market Indices and Statistics |
| Region | United States |
| Source | Robert Shiller |
Stats
| Last Value | 41.37 |
| Latest Period | Jul 2026 |
| Last Updated | Jul 8 2026, 19:05 EDT |
| Next Release | Aug 8 2026, 19:00 EDT (E) |
| Average Growth Rate | 1.58% |
| Value from Last Month | 40.91 |
| Change from Last Month | 1.13% |
| Value from 1 Year Ago | 37.47 |
| Change from 1 Year Ago | 10.39% |
| Frequency | Monthly |
| Adjustment | N/A |
| Download Source File |
Related Indicators
| S&P 500 Fundamentals |
| S&P 500 Dividend Yield (DISCONTINUED) | 1.15% |
| S&P 500 Earnings Yield (DISCONTINUED) | 3.50% |
| S&P 500 Market Cap (DISCONTINUED) | 58.44T USD |
| S&P 500 P/E Ratio (DISCONTINUED) | 28.58 |
| S&P 500 Price to Book Ratio (DISCONTINUED) | 5.265 |
| SPX Put/Call Ratio | 1.17 |
| VIX | 18.58 |