

S&P 500 (I:SP500NM)
7503.85 USD for Jul 2026
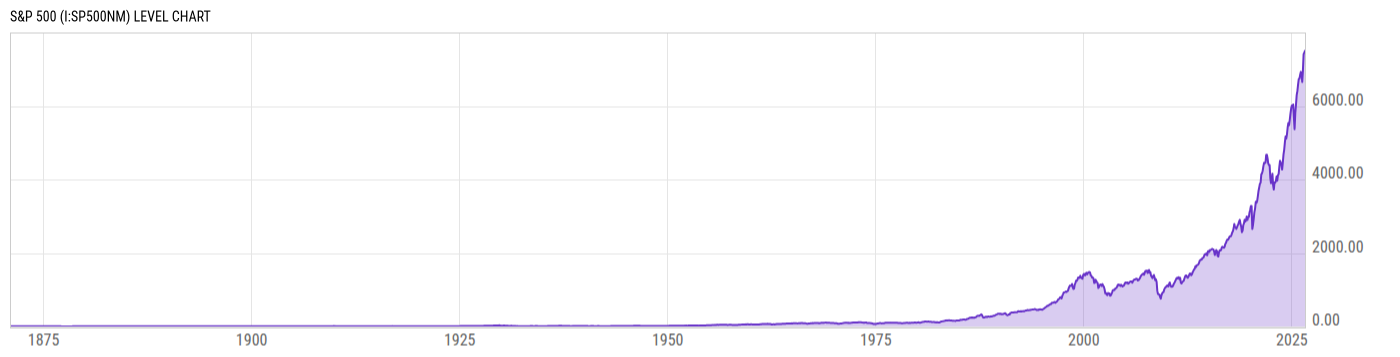
Level Chart
Basic Info
|
S&P 500 is at a current level of 7503.85, up from 7450.03 last month and up from 6296.50 one year ago. This is a change of 0.72% from last month and 19.17% from one year ago. |
| Report | Shiller S&P 500 PE 10 |
| Category | Market Indices and Statistics |
| Region | United States |
| Source | Robert Shiller |
Stats
| Last Value | 7503.85 |
| Latest Period | Jul 2026 |
| Last Updated | Jul 8 2026, 19:05 EDT |
| Next Release | Aug 8 2026, 19:00 EDT (E) |
| Average Growth Rate | 5.77% |
| Value from Last Month | 7450.03 |
| Change from Last Month | 0.72% |
| Value from 1 Year Ago | 6296.50 |
| Change from 1 Year Ago | 19.17% |
| Frequency | Monthly |
| Unit | USD |
| Adjustment | N/A |
| Download Source File |
Historical Data
| Date | Value |
|---|---|
| July 31, 2026 | 7503.85 |
| June 30, 2026 | 7450.03 |
| May 31, 2026 | 7412.55 |
| April 30, 2026 | 6957.01 |
| March 31, 2026 | 6654.42 |
| February 28, 2026 | 6893.81 |
| January 31, 2026 | 6929.12 |
| December 31, 2025 | 6853.03 |
| November 30, 2025 | 6740.89 |
| October 31, 2025 | 6735.69 |
| September 30, 2025 | 6584.02 |
| August 31, 2025 | 6408.95 |
| July 31, 2025 | 6296.50 |
| June 30, 2025 | 6029.95 |
| May 31, 2025 | 5810.92 |
| April 30, 2025 | 5369.50 |
| March 31, 2025 | 5683.98 |
| February 28, 2025 | 6038.69 |
| January 31, 2025 | 5979.52 |
| December 31, 2024 | 6010.91 |
| November 30, 2024 | 5929.92 |
| October 31, 2024 | 5792.32 |
| September 30, 2024 | 5621.26 |
| August 31, 2024 | 5478.21 |
| July 31, 2024 | 5538.00 |
| Date | Value |
|---|---|
| June 30, 2024 | 5415.14 |
| May 31, 2024 | 5235.23 |
| April 30, 2024 | 5112.49 |
| March 31, 2024 | 5170.57 |
| February 29, 2024 | 5011.96 |
| January 31, 2024 | 4815.61 |
| December 31, 2023 | 4685.05 |
| November 30, 2023 | 4460.06 |
| October 31, 2023 | 4269.40 |
| September 30, 2023 | 4409.10 |
| August 31, 2023 | 4457.36 |
| July 31, 2023 | 4508.08 |
| June 30, 2023 | 4345.37 |
| May 31, 2023 | 4146.17 |
| April 30, 2023 | 4121.47 |
| March 31, 2023 | 3968.56 |
| February 28, 2023 | 4079.68 |
| January 31, 2023 | 3960.66 |
| December 31, 2022 | 3912.38 |
| November 30, 2022 | 3917.49 |
| October 31, 2022 | 3726.05 |
| September 30, 2022 | 3850.52 |
| August 31, 2022 | 4158.56 |
| July 31, 2022 | 3911.73 |
| June 30, 2022 | 3898.95 |
News
Headline
Time (ET)
07/02 16:23
US Equity Indexes Mixed, Mag-7 Lags Amid Micron Technology's Blockbuster Quarterly Results This Week
06/26 16:33
06/22 14:04
06/12 16:45
Basic Info
|
S&P 500 is at a current level of 7503.85, up from 7450.03 last month and up from 6296.50 one year ago. This is a change of 0.72% from last month and 19.17% from one year ago. |
| Report | Shiller S&P 500 PE 10 |
| Category | Market Indices and Statistics |
| Region | United States |
| Source | Robert Shiller |
Stats
| Last Value | 7503.85 |
| Latest Period | Jul 2026 |
| Last Updated | Jul 8 2026, 19:05 EDT |
| Next Release | Aug 8 2026, 19:00 EDT (E) |
| Average Growth Rate | 5.77% |
| Value from Last Month | 7450.03 |
| Change from Last Month | 0.72% |
| Value from 1 Year Ago | 6296.50 |
| Change from 1 Year Ago | 19.17% |
| Frequency | Monthly |
| Unit | USD |
| Adjustment | N/A |
| Download Source File |
Related Indicators
| US Markets |
| S&P 500 1 Year Return (DISCONTINUED) | 14.87% |
| S&P 500 Monthly Total Return (DISCONTINUED) | 1.37% |
| S&P 500 P/E Ratio (DISCONTINUED) | 28.58 |
| VIX | 15.03 |
| VIX Put/Call Ratio | 0.44 |
| Wilshire 5000 Price Index (DISCONTINUED) | 52875.49 USD |