

BlackRock Health Sciences Opportunities Port Inst (SHSSX)
67.56
+0.47
(+0.70%)
USD |
May 21 2026
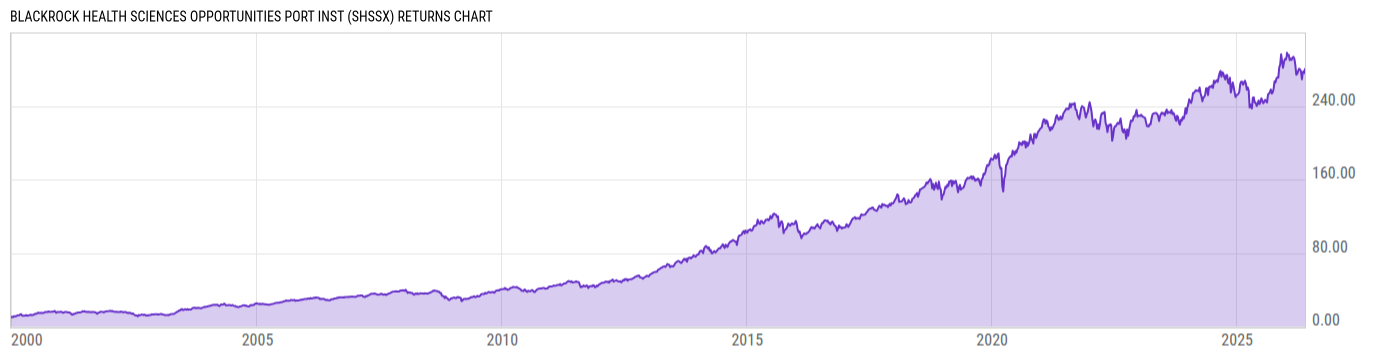
Returns Chart
Key Stats
| Net Expense Ratio | Total Assets Under Management | Weighted Average Dividend Yield | Turnover Ratio (Generic) |
|---|---|---|---|
| 0.84% | 5.840B | 1.05% | 43.00% |
| 1 Year Fund Level Flows | 1 Year Total Returns (Daily) | Annualized Total Returns Since Inception (Daily) | Max Drawdown (Since Inception) |
| -1.580B | 16.13% |
Basic Info
| Investment Strategy | |
| The Fund seeks long-term growth of capital. Under normal market conditions, the Fund invests at least 80% of total assets in equity securities, primarily common stock, of companies in health sciences and related industries. The Fund reserves the right to invest up to 20% of its total assets in other types of securities. |
| General | |
| Security Type | Mutual Fund |
| Equity Style | Large Cap Core |
| Broad Asset Class | Sector Equity |
| Broad Category | Equity |
| Global Peer Group | Equity Sector Healthcare |
| Peer Group | Health/Biotechnology Funds |
| Global Macro | Equity Industry Sector |
| US Macro | Sector Equity Funds |
| YCharts Categorization | -- |
| YCharts Benchmark | -- |
| Prospectus Objective | Health/Biotechnology Funds |
| Fund Owner Firm Name | BlackRock |
| Broad Asset Class Benchmark Index | |
| ^MSWNTR | 100.0% |
Net Fund Flows Versus Peer Group
1 Month
% Rank:
96
-544.14M
Peer Group Low
637.08M
Peer Group High
1 Year
% Rank:
98
-1.580B
-2.461B
Peer Group Low
1.069B
Peer Group High
3 Months
% Rank:
94
-929.88M
Peer Group Low
166.12M
Peer Group High
3 Years
% Rank:
97
-6.931B
Peer Group Low
600.89M
Peer Group High
6 Months
% Rank:
98
-1.002B
Peer Group Low
1.136B
Peer Group High
5 Years
% Rank:
98
-8.512B
Peer Group Low
3.739B
Peer Group High
YTD
% Rank:
96
-599.30M
Peer Group Low
1.055B
Peer Group High
10 Years
% Rank:
96
-12.96B
Peer Group Low
5.580B
Peer Group High
Date Unavailable
Risk
Performance Versus Peer Group
Annual Total Returns Versus Peers
As of May 22, 2026.
Asset Allocation
As of November 30, 2025.
| Type | % Net |
|---|---|
| Cash | 0.36% |
| Stock | 99.27% |
| Bond | 0.29% |
| Convertible | 0.00% |
| Preferred | 0.08% |
| Other | 0.00% |
Top 10 Holdings
| Name | % Weight | Price | % Change |
|---|---|---|---|
| Eli Lilly & Co. | 10.81% | 1064.94 | 2.24% |
| Johnson & Johnson | 9.53% | 234.47 | 1.18% |
| UnitedHealth Group, Inc. | 6.02% | 388.99 | 1.70% |
| Merck & Co., Inc. | 4.35% | 121.99 | 5.27% |
| AbbVie, Inc. | 4.19% | 217.18 | 1.25% |
| Gilead Sciences, Inc. | 3.89% | 133.75 | 2.49% |
| Amgen, Inc. | 3.49% | 338.96 | 0.46% |
| Thermo Fisher Scientific, Inc. | 2.97% | 446.13 | -0.72% |
| Intuitive Surgical, Inc. | 2.85% | 438.97 | -0.19% |
| Pfizer Inc. | 2.70% | 25.94 | -0.06% |
Fees & Availability
| Fees | |
| Actual 12B-1 Fee | -- |
| Actual Management Fee | 0.67% |
| Administration Fee | 2.22M% |
| Maximum Front Load | -- |
| Maximum Deferred Load | -- |
| Maximum Redemption Fee | 0.00% |
| General Availability | |
| Available for Insurance Product | No |
| Available for RRSP | No |
| Purchase Details | |
| Open to New Investors |
|
| Minimum Initial Investment | 2.00M None |
| Minimum Subsequent Investment | 0.00 None |
Basic Info
| Investment Strategy | |
| The Fund seeks long-term growth of capital. Under normal market conditions, the Fund invests at least 80% of total assets in equity securities, primarily common stock, of companies in health sciences and related industries. The Fund reserves the right to invest up to 20% of its total assets in other types of securities. |
| General | |
| Security Type | Mutual Fund |
| Equity Style | Large Cap Core |
| Broad Asset Class | Sector Equity |
| Broad Category | Equity |
| Global Peer Group | Equity Sector Healthcare |
| Peer Group | Health/Biotechnology Funds |
| Global Macro | Equity Industry Sector |
| US Macro | Sector Equity Funds |
| YCharts Categorization | -- |
| YCharts Benchmark | -- |
| Prospectus Objective | Health/Biotechnology Funds |
| Fund Owner Firm Name | BlackRock |
| Broad Asset Class Benchmark Index | |
| ^MSWNTR | 100.0% |
Fundamentals
| General | |
| Distribution Yield | -- |
| Dividend Yield TTM (5-20-26) | 0.42% |
| 30-Day SEC Yield | -- |
| 7-Day SEC Yield | -- |
| Number of Holdings | 10 |
| Stock | |
| Weighted Average PE Ratio | 35.62 |
| Weighted Average Price to Sales Ratio | 8.961 |
| Weighted Average Price to Book Ratio | 10.55 |
| Weighted Median ROE | 141.6% |
| Weighted Median ROA | 5.75% |
| ROI (TTM) | 9.34% |
| Return on Investment (TTM) | 9.34% |
| Earning Yield | 0.0355 |
| LT Debt / Shareholders Equity | 3.121 |
| Number of Equity Holdings | 10 |
As of November 30, 2025
Growth Metrics
| EPS Growth (1Y) | 19.91% |
| EPS Growth (3Y) | 5.20% |
| EPS Growth (5Y) | 8.52% |
| Sales Growth (1Y) | 13.38% |
| Sales Growth (3Y) | 9.73% |
| Sales Growth (5Y) | 12.39% |
| Sales per Share Growth (1Y) | 20.60% |
| Sales per Share Growth (3Y) | 11.21% |
| Operating Cash Flow - Growth Rate (3Y) | 2.94% |
As of November 30, 2025
Fund Details
Top Portfolio Holders
| Name | % Weight |
|---|---|
| Portfolio A | 5.00% |
| Portfolio B | 3.50% |
| Portfolio C | 2.25% |
Excel Add-In Codes
| Name: =YCI("M:SHSSX", "name") |
| Broad Asset Class: =YCI("M:SHSSX", "broad_asset_class") |
| Broad Category: =YCI("M:SHSSX", "broad_category_group") |
| Prospectus Objective: =YCI("M:SHSSX", "prospectus_objective") |
| To find the codes for any of our securities and financial metrics, see our Complete Excel Reference. |