

DWS Health and Wellness Fund Institutional (SUHIX)
44.68
+0.62
(+1.41%)
USD |
Jun 09 2026
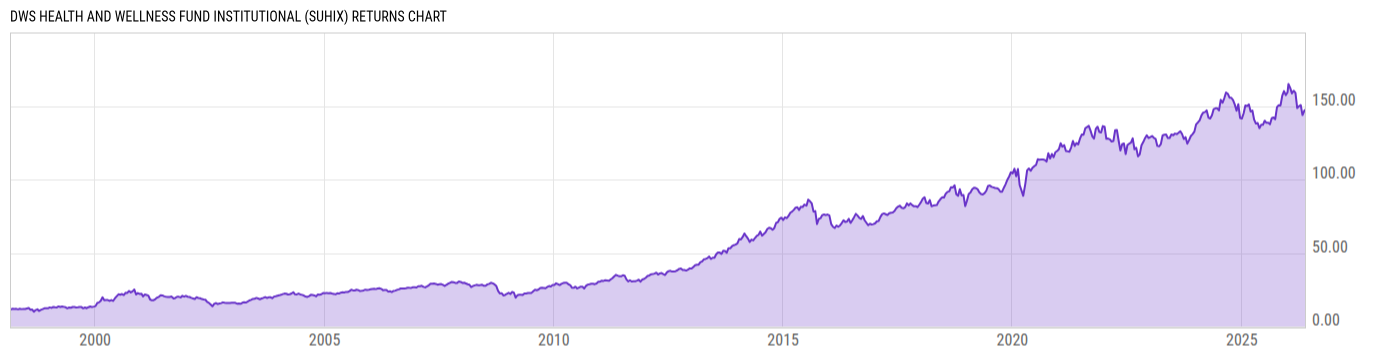
Returns Chart
Key Stats
| Net Expense Ratio | Total Assets Under Management | Weighted Average Dividend Yield | Turnover Ratio (Generic) |
|---|---|---|---|
| 1.03% | 236.54M | 1.46% | 1.00% |
| 1 Year Fund Level Flows | 1 Year Total Returns (Daily) | Annualized Total Returns Since Inception (Daily) | Max Drawdown (Since Inception) |
| -35.11M | 11.14% |
Basic Info
| Investment Strategy | |
| The Fund seeks long-term growth of capital by investing, under normal circumstances, at least 80% of its total assets in common stocks of companies in the health care sector. The industries in the health care sector include pharmaceuticals, biotechnology, medical products and supplies, and health care services. |
| General | |
| Security Type | Mutual Fund |
| Equity Style | Large Cap Core |
| Broad Asset Class | Sector Equity |
| Broad Category | Equity |
| Global Peer Group | Equity Sector Healthcare |
| Peer Group | Health/Biotechnology Funds |
| Global Macro | Equity Industry Sector |
| US Macro | Sector Equity Funds |
| YCharts Categorization | -- |
| YCharts Benchmark | -- |
| Prospectus Objective | Health/Biotechnology Funds |
| Fund Owner Firm Name | DWS |
| Broad Asset Class Benchmark Index | |
| ^MSWNTR | 100.0% |
Net Fund Flows Versus Peer Group
1 Month
% Rank:
55
-481.95M
Peer Group Low
233.80M
Peer Group High
1 Year
% Rank:
54
-35.11M
-2.382B
Peer Group Low
1.147B
Peer Group High
3 Months
% Rank:
47
-2.094B
Peer Group Low
145.91M
Peer Group High
3 Years
% Rank:
48
-8.608B
Peer Group Low
663.45M
Peer Group High
6 Months
% Rank:
58
-1.037B
Peer Group Low
1.149B
Peer Group High
5 Years
% Rank:
52
-8.597B
Peer Group Low
1.644B
Peer Group High
YTD
% Rank:
54
-763.35M
Peer Group Low
1.117B
Peer Group High
10 Years
% Rank:
55
-12.93B
Peer Group Low
5.473B
Peer Group High
Date Unavailable
Risk
Performance Versus Peer Group
Annual Total Returns Versus Peers
As of June 10, 2026.
Asset Allocation
As of March 31, 2026.
| Type | % Net |
|---|---|
| Cash | 0.00% |
| Stock | 99.48% |
| Bond | 0.00% |
| Convertible | 0.00% |
| Preferred | 0.00% |
| Other | 0.52% |
Top 10 Holdings
| Name | % Weight | Price | % Change |
|---|---|---|---|
| Eli Lilly & Co. | 12.18% | 1158.00 | 1.16% |
| Johnson & Johnson | 6.61% | 239.39 | 1.01% |
| Merck & Co., Inc. | 4.84% | 118.40 | -1.00% |
| AbbVie, Inc. | 4.82% | 226.49 | 0.47% |
| UnitedHealth Group, Inc. | 4.70% | 409.16 | -0.93% |
| AstraZeneca PLC | 3.98% | 180.54 | -1.58% |
| Thermo Fisher Scientific, Inc. | 3.40% | 488.55 | -1.12% |
| Amgen, Inc. | 2.96% | 346.88 | 0.67% |
| Novartis AG | 2.90% | 149.14 | 0.01% |
| Intuitive Surgical, Inc. | 2.87% | 419.34 | -1.70% |
Fees & Availability
| Fees | |
| Actual 12B-1 Fee | -- |
| Actual Management Fee | 0.77% |
| Administration Fee | 14.51K% |
| Maximum Front Load | -- |
| Maximum Deferred Load | -- |
| Maximum Redemption Fee | 0.00% |
| General Availability | |
| Available for Insurance Product | No |
| Available for RRSP | No |
| Purchase Details | |
| Open to New Investors |
|
| Minimum Initial Investment | 1.00M None |
| Minimum Subsequent Investment | 0.00 None |
Basic Info
| Investment Strategy | |
| The Fund seeks long-term growth of capital by investing, under normal circumstances, at least 80% of its total assets in common stocks of companies in the health care sector. The industries in the health care sector include pharmaceuticals, biotechnology, medical products and supplies, and health care services. |
| General | |
| Security Type | Mutual Fund |
| Equity Style | Large Cap Core |
| Broad Asset Class | Sector Equity |
| Broad Category | Equity |
| Global Peer Group | Equity Sector Healthcare |
| Peer Group | Health/Biotechnology Funds |
| Global Macro | Equity Industry Sector |
| US Macro | Sector Equity Funds |
| YCharts Categorization | -- |
| YCharts Benchmark | -- |
| Prospectus Objective | Health/Biotechnology Funds |
| Fund Owner Firm Name | DWS |
| Broad Asset Class Benchmark Index | |
| ^MSWNTR | 100.0% |
Fundamentals
| General | |
| Distribution Yield | -- |
| Dividend Yield TTM (6-8-26) | 0.30% |
| 30-Day SEC Yield | -- |
| 7-Day SEC Yield | -- |
| Number of Holdings | 65 |
| Stock | |
| Weighted Average PE Ratio | 31.50 |
| Weighted Average Price to Sales Ratio | 6.302 |
| Weighted Average Price to Book Ratio | 9.189 |
| Weighted Median ROE | 349.3% |
| Weighted Median ROA | 10.39% |
| ROI (TTM) | 15.26% |
| Return on Investment (TTM) | 15.26% |
| Earning Yield | 0.0364 |
| LT Debt / Shareholders Equity | 1.090 |
| Number of Equity Holdings | 63 |
As of March 31, 2026
Growth Metrics
| EPS Growth (1Y) | 37.36% |
| EPS Growth (3Y) | 16.38% |
| EPS Growth (5Y) | 16.65% |
| Sales Growth (1Y) | 14.32% |
| Sales Growth (3Y) | 11.82% |
| Sales Growth (5Y) | 11.80% |
| Sales per Share Growth (1Y) | 15.07% |
| Sales per Share Growth (3Y) | 12.53% |
| Operating Cash Flow - Growth Rate (3Y) | 10.08% |
As of March 31, 2026
Fund Details
Top Portfolio Holders
| Name | % Weight |
|---|---|
| Portfolio A | 5.00% |
| Portfolio B | 3.50% |
| Portfolio C | 2.25% |
Excel Add-In Codes
| Name: =YCI("M:SUHIX", "name") |
| Broad Asset Class: =YCI("M:SUHIX", "broad_asset_class") |
| Broad Category: =YCI("M:SUHIX", "broad_category_group") |
| Prospectus Objective: =YCI("M:SUHIX", "prospectus_objective") |
| To find the codes for any of our securities and financial metrics, see our Complete Excel Reference. |