

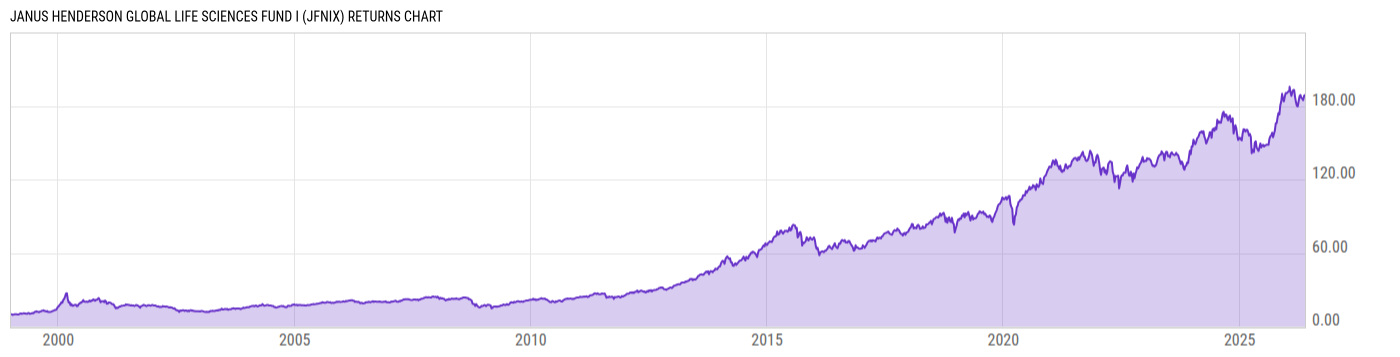
Janus Henderson Global Life Sciences Fund I (JFNIX)
82.23
+1.18
(+1.46%)
USD |
Jun 09 2026
Returns Chart
Key Stats
| Net Expense Ratio | Total Assets Under Management | Weighted Average Dividend Yield | Turnover Ratio (Generic) |
|---|---|---|---|
| 0.78% | 5.396B | 1.07% | 30.00% |
| 1 Year Fund Level Flows | 1 Year Total Returns (Daily) | Annualized Total Returns Since Inception (Daily) | Max Drawdown (Since Inception) |
| -260.99M | 30.00% |
Basic Info
| Investment Strategy | |
| The Fund seeks long-term growth of capital. The Fund invests, under normal circumstances, at least 80% of its net assets in securities of companies that the portfolio managers believe have a life science orientation. The Fund normally invests in issuers from several different countries, which may include United States. |
| General | |
| Security Type | Mutual Fund |
| Equity Style | Multi Cap Core |
| Broad Asset Class | Sector Equity |
| Broad Category | Equity |
| Global Peer Group | Equity Sector Healthcare |
| Peer Group | Global Health/Biotechnology Funds |
| Global Macro | Equity Industry Sector |
| US Macro | World Sector Equity Funds |
| YCharts Categorization | -- |
| YCharts Benchmark | -- |
| Prospectus Objective | Global Health/Biotechnology Funds |
| Fund Owner Firm Name | Janus Henderson Investors |
| Broad Asset Class Benchmark Index | |
| ^MSWNTR | 100.0% |
Net Fund Flows Versus Peer Group
1 Month
% Rank:
64
-409.63M
Peer Group Low
10.07M
Peer Group High
1 Year
% Rank:
88
-260.99M
-5.639B
Peer Group Low
820.51M
Peer Group High
3 Months
% Rank:
11
-1.159B
Peer Group Low
275.09M
Peer Group High
3 Years
% Rank:
88
-15.86B
Peer Group Low
820.51M
Peer Group High
6 Months
% Rank:
21
-2.299B
Peer Group Low
814.57M
Peer Group High
5 Years
% Rank:
90
-21.35B
Peer Group Low
820.51M
Peer Group High
YTD
% Rank:
15
-1.810B
Peer Group Low
814.58M
Peer Group High
10 Years
% Rank:
90
-43.24B
Peer Group Low
820.51M
Peer Group High
Date Unavailable
Risk
Performance Versus Peer Group
Annual Total Returns Versus Peers
As of June 10, 2026.
Asset Allocation
As of March 31, 2026.
| Type | % Net |
|---|---|
| Cash | 0.00% |
| Stock | 99.07% |
| Bond | 0.00% |
| Convertible | 0.00% |
| Preferred | 0.26% |
| Other | 0.67% |
Top 10 Holdings
| Name | % Weight | Price | % Change |
|---|---|---|---|
| Eli Lilly & Co. | 8.86% | 1136.26 | -0.74% |
| Johnson & Johnson | 7.29% | 238.52 | 0.64% |
| AstraZeneca PLC | 4.59% | 178.84 | -2.50% |
| AbbVie, Inc. | 4.07% | 224.91 | -0.23% |
| UnitedHealth Group, Inc. | 3.13% | 407.60 | -1.31% |
| Novartis AG | 2.85% | 148.14 | -0.66% |
| Thermo Fisher Scientific, Inc. | 2.51% | 482.08 | -2.43% |
| Praxis Precision Medicines, Inc. | 2.45% | 240.62 | -3.88% |
| argenx SE | 2.40% | 861.59 | -2.54% |
| Abbott Laboratories | 2.39% | 89.12 | -2.33% |
Fees & Availability
| Fees | |
| Actual 12B-1 Fee | -- |
| Actual Management Fee | 0.64% |
| Administration Fee | -- |
| Maximum Front Load | -- |
| Maximum Deferred Load | -- |
| Maximum Redemption Fee | 0.00% |
| General Availability | |
| Available for Insurance Product | No |
| Available for RRSP | No |
| Purchase Details | |
| Open to New Investors |
|
| Minimum Initial Investment | 0.00 None |
| Minimum Subsequent Investment | 0.00 None |
Basic Info
| Investment Strategy | |
| The Fund seeks long-term growth of capital. The Fund invests, under normal circumstances, at least 80% of its net assets in securities of companies that the portfolio managers believe have a life science orientation. The Fund normally invests in issuers from several different countries, which may include United States. |
| General | |
| Security Type | Mutual Fund |
| Equity Style | Multi Cap Core |
| Broad Asset Class | Sector Equity |
| Broad Category | Equity |
| Global Peer Group | Equity Sector Healthcare |
| Peer Group | Global Health/Biotechnology Funds |
| Global Macro | Equity Industry Sector |
| US Macro | World Sector Equity Funds |
| YCharts Categorization | -- |
| YCharts Benchmark | -- |
| Prospectus Objective | Global Health/Biotechnology Funds |
| Fund Owner Firm Name | Janus Henderson Investors |
| Broad Asset Class Benchmark Index | |
| ^MSWNTR | 100.0% |
Fundamentals
| General | |
| Distribution Yield | -- |
| Dividend Yield TTM (6-8-26) | 0.46% |
| 30-Day SEC Yield | -- |
| 7-Day SEC Yield | -- |
| Number of Holdings | 99 |
| Stock | |
| Weighted Average PE Ratio | 31.42 |
| Weighted Average Price to Sales Ratio | 7.791 |
| Weighted Average Price to Book Ratio | 8.811 |
| Weighted Median ROE | 579.0% |
| Weighted Median ROA | 0.93% |
| ROI (TTM) | 4.57% |
| Return on Investment (TTM) | 4.57% |
| Earning Yield | 0.0378 |
| LT Debt / Shareholders Equity | 0.9212 |
| Number of Equity Holdings | 97 |
As of March 31, 2026
Growth Metrics
| EPS Growth (1Y) | 33.01% |
| EPS Growth (3Y) | 18.66% |
| EPS Growth (5Y) | 14.85% |
| Sales Growth (1Y) | 22.68% |
| Sales Growth (3Y) | 20.69% |
| Sales Growth (5Y) | 18.85% |
| Sales per Share Growth (1Y) | 402.4% |
| Sales per Share Growth (3Y) | 20.82% |
| Operating Cash Flow - Growth Rate (3Y) | 9.79% |
As of March 31, 2026
Fund Details
Top Portfolio Holders
| Name | % Weight |
|---|---|
| Portfolio A | 5.00% |
| Portfolio B | 3.50% |
| Portfolio C | 2.25% |
Excel Add-In Codes
| Name: =YCI("M:JFNIX", "name") |
| Broad Asset Class: =YCI("M:JFNIX", "broad_asset_class") |
| Broad Category: =YCI("M:JFNIX", "broad_category_group") |
| Prospectus Objective: =YCI("M:JFNIX", "prospectus_objective") |
| To find the codes for any of our securities and financial metrics, see our Complete Excel Reference. |