

John Hancock Multimanager 2030 Lifetime Ptf R2 (JLFEX)
10.87
+0.01
(+0.09%)
USD |
Jun 09 2026
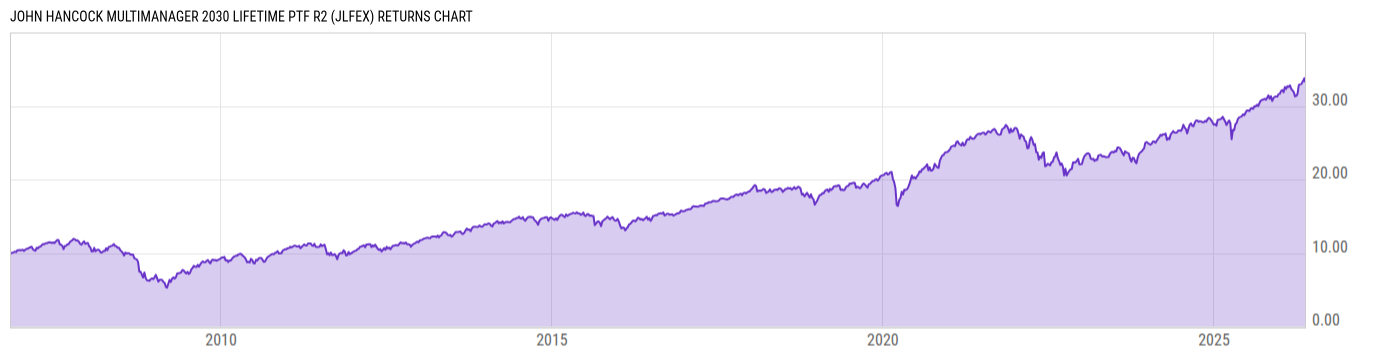
Returns Chart
Key Stats
| Net Expense Ratio | Total Assets Under Management | Weighted Average Dividend Yield | Turnover Ratio (Generic) |
|---|---|---|---|
| 1.08% | 1.040B | -- | 29.00% |
| 1 Year Fund Level Flows | 1 Year Total Returns (Daily) | Annualized Total Returns Since Inception (Daily) | Max Drawdown (Since Inception) |
| -195.71M | 16.42% |
Basic Info
| Investment Strategy | |
| The Fund seeks high total return and capital appreciation until its target retirement date. The Fund invests its assets in underlying Funds using an asset allocation strategy designed for investors expected to retire in 2030. The fund may invest in a broad range of equity and fixed-income securities including derivatives. |
| General | |
| Security Type | Mutual Fund |
| Equity Style | -- |
| Broad Asset Class | Allocation |
| Broad Category | Allocation |
| Global Peer Group | Target Maturity MA USD 2030 |
| Peer Group | Mixed-Asset Target 2030 Funds |
| Global Macro | Target Maturity |
| US Macro | Mixed-Assets Target Date Funds |
| YCharts Categorization | -- |
| YCharts Benchmark | -- |
| Prospectus Objective | Growth & Income Funds |
| Fund Owner Firm Name | John Hancock Group |
| Broad Asset Class Benchmark Index | |
| ^SPXTR | 100.0% |
Net Fund Flows Versus Peer Group
1 Month
% Rank:
59
-811.40M
Peer Group Low
234.84M
Peer Group High
1 Year
% Rank:
70
-195.71M
-4.696B
Peer Group Low
962.54M
Peer Group High
3 Months
% Rank:
61
-1.806B
Peer Group Low
542.00M
Peer Group High
3 Years
% Rank:
71
-9.883B
Peer Group Low
1.826B
Peer Group High
6 Months
% Rank:
70
-2.516B
Peer Group Low
918.80M
Peer Group High
5 Years
% Rank:
80
-15.30B
Peer Group Low
6.858B
Peer Group High
YTD
% Rank:
70
-2.086B
Peer Group Low
647.97M
Peer Group High
10 Years
% Rank:
81
-29.27B
Peer Group Low
16.93B
Peer Group High
Date Unavailable
Risk
Performance Versus Peer Group
Annual Total Returns Versus Peers
As of June 10, 2026.
Asset Allocation
As of February 28, 2026.
| Type | % Net |
|---|---|
| Cash | 1.27% |
| Stock | 57.63% |
| Bond | 40.00% |
| Convertible | 0.00% |
| Preferred | 0.49% |
| Other | 0.61% |
Top 10 Holdings
| Name | % Weight | Price | % Change |
|---|---|---|---|
| John Hancock US Sector Rotation Fund NAV | 11.01% | 14.62 | 0.27% |
| John Hancock International Strat Eqty Alloc NAV | 10.01% | 13.85 | 0.29% |
| John Hancock Core Bond Fund NAV | 9.80% | 10.94 | 0.18% |
| John Hancock Bond Fund NAV | 9.38% | 13.44 | -0.07% |
| John Hancock Disciplined Value Fund NAV | 5.91% | 28.60 | 0.32% |
| John Hancock Blue Chip Growth Fund NAV | 5.35% | 66.77 | 0.51% |
|
JOHN HANCOCK SHORT DURATION BOND FUND;NAV
|
5.00% | -- | -- |
| John Hancock Disciplined Value Internatl Fd NAV | 4.43% | 18.25 | 0.00% |
| John Hancock Diversified Real Assets Fund NAV | 4.16% | 13.84 | -0.14% |
| John Hancock Emerging Markets Debt Fund NAV | 3.57% | 8.16 | -0.24% |
Fees & Availability
| Fees | |
| Actual 12B-1 Fee | 0.25% |
| Actual Management Fee | -- |
| Administration Fee | -- |
| Maximum Front Load | -- |
| Maximum Deferred Load | -- |
| Maximum Redemption Fee | -- |
| General Availability | |
| Available for Insurance Product | No |
| Available for RRSP | No |
| Purchase Details | |
| Open to New Investors |
|
| Minimum Initial Investment | 0.00 None |
| Minimum Subsequent Investment | 0.00 None |
Basic Info
| Investment Strategy | |
| The Fund seeks high total return and capital appreciation until its target retirement date. The Fund invests its assets in underlying Funds using an asset allocation strategy designed for investors expected to retire in 2030. The fund may invest in a broad range of equity and fixed-income securities including derivatives. |
| General | |
| Security Type | Mutual Fund |
| Equity Style | -- |
| Broad Asset Class | Allocation |
| Broad Category | Allocation |
| Global Peer Group | Target Maturity MA USD 2030 |
| Peer Group | Mixed-Asset Target 2030 Funds |
| Global Macro | Target Maturity |
| US Macro | Mixed-Assets Target Date Funds |
| YCharts Categorization | -- |
| YCharts Benchmark | -- |
| Prospectus Objective | Growth & Income Funds |
| Fund Owner Firm Name | John Hancock Group |
| Broad Asset Class Benchmark Index | |
| ^SPXTR | 100.0% |
Fundamentals
| General | |
| Distribution Yield | -- |
| Dividend Yield TTM (6-8-26) | 2.65% |
| 30-Day SEC Yield | -- |
| 7-Day SEC Yield | -- |
| Number of Holdings | 94 |
| Stock | |
| Weighted Average PE Ratio | 29.72 |
| Weighted Average Price to Sales Ratio | 6.342 |
| Weighted Average Price to Book Ratio | 7.583 |
| Weighted Median ROE | 50.56% |
| Weighted Median ROA | 10.99% |
| ROI (TTM) | 16.71% |
| Return on Investment (TTM) | 16.71% |
| Earning Yield | 0.0434 |
| LT Debt / Shareholders Equity | 20.88 |
| Number of Equity Holdings | 58 |
| Bond | |
| Yield to Maturity (2-28-26) | 4.76% |
| Effective Duration | -- |
| Average Coupon | 4.79% |
| Calculated Average Quality | 3.437 |
| Effective Maturity | 12.74 |
| Nominal Maturity | 13.27 |
| Number of Bond Holdings | 8 |
As of February 28, 2026
Growth Metrics
| EPS Growth (1Y) | 25.01% |
| EPS Growth (3Y) | 17.34% |
| EPS Growth (5Y) | 21.45% |
| Sales Growth (1Y) | 13.28% |
| Sales Growth (3Y) | 11.73% |
| Sales Growth (5Y) | 13.88% |
| Sales per Share Growth (1Y) | 17.38% |
| Sales per Share Growth (3Y) | 11.80% |
| Operating Cash Flow - Growth Rate (3Y) | 20.86% |
As of February 28, 2026
Fund Details
| Key Dates | |
| Inception Date | 10/30/2006 |
| Last Annual Report Date | 8/31/2025 |
| Last Prospectus Date | 1/1/2026 |
| Share Classes | |
| JHRGX | Inst |
| JLFAX | A |
| JLFGX | Retirement |
| JLFHX | Retirement |
| JLFIX | Retirement |
| JLFOX | Other |
| Attributes | |
| Index Fund | -- |
| Inverse Fund | No |
| Leveraged Fund | -- |
| Fund of Funds |
|
| Currency Hedged Fund | -- |
| Socially Responsible Fund | No |
Top Portfolio Holders
| Name | % Weight |
|---|---|
| Portfolio A | 5.00% |
| Portfolio B | 3.50% |
| Portfolio C | 2.25% |
Excel Add-In Codes
| Name: =YCI("M:JLFEX", "name") |
| Broad Asset Class: =YCI("M:JLFEX", "broad_asset_class") |
| Broad Category: =YCI("M:JLFEX", "broad_category_group") |
| Prospectus Objective: =YCI("M:JLFEX", "prospectus_objective") |
| To find the codes for any of our securities and financial metrics, see our Complete Excel Reference. |