

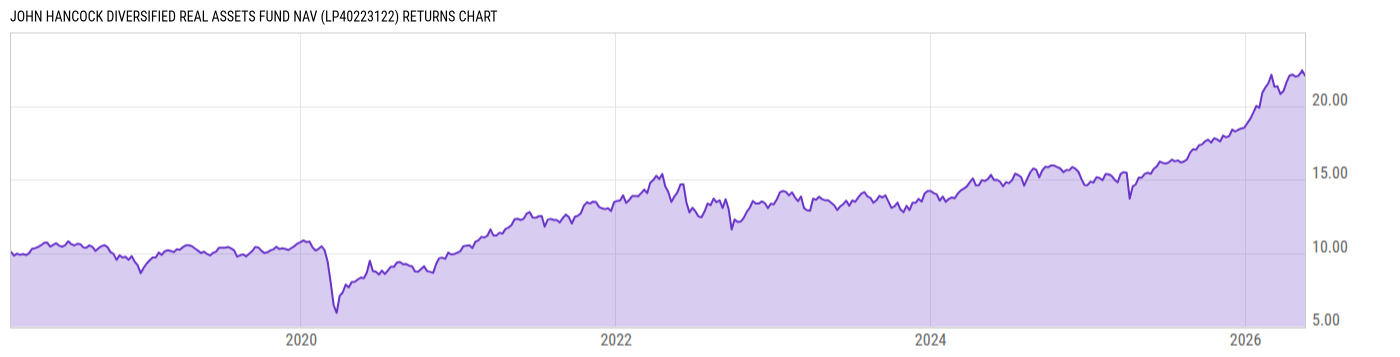
John Hancock Diversified Real Assets Fund NAV (LP40223122)
13.84
-0.02
(-0.14%)
USD |
Jun 08 2026
Returns Chart
Key Stats
| Net Expense Ratio | Total Assets Under Management | Weighted Average Dividend Yield | Turnover Ratio (Generic) |
|---|---|---|---|
| 0.86% | 943.54M | 2.39% | 42.00% |
| 1 Year Fund Level Flows | 1 Year Total Returns (Daily) | Annualized Total Returns Since Inception (Daily) | Max Drawdown (Since Inception) |
| -143.34M | 36.31% |
Basic Info
| Investment Strategy | |
| The Fund seeks a long-term total return in excess of inflation. The fund invests at least 80% of its net assets in securities of real asset companies worldwide which include real estate companies, natural resources companies, infrastructure companies, master limited partnerships, and agriculture and timber companies. |
| General | |
| Security Type | Mutual Fund |
| Equity Style | Multi Cap Value |
| Broad Asset Class | Allocation |
| Broad Category | Allocation |
| Global Peer Group | Mixed Asset USD Flexible - Global |
| Peer Group | Real Return Funds |
| Global Macro | Mixed Asset HC Flexible |
| US Macro | Mixed-Assets Funds |
| YCharts Categorization | -- |
| YCharts Benchmark | -- |
| Prospectus Objective | Real Return Funds |
| Fund Owner Firm Name | John Hancock Group |
| Broad Asset Class Benchmark Index | |
| ^SPXTR | 100.0% |
Net Fund Flows Versus Peer Group
1 Month
% Rank:
97
-91.91M
Peer Group Low
102.61M
Peer Group High
1 Year
% Rank:
93
-143.34M
-3.447B
Peer Group Low
761.88M
Peer Group High
3 Months
% Rank:
4
-767.72M
Peer Group Low
391.06M
Peer Group High
3 Years
% Rank:
85
-2.001B
Peer Group Low
758.22M
Peer Group High
6 Months
% Rank:
16
-2.264B
Peer Group Low
665.69M
Peer Group High
5 Years
% Rank:
90
-2.337B
Peer Group Low
1.294B
Peer Group High
YTD
% Rank:
11
-1.564B
Peer Group Low
653.00M
Peer Group High
10 Years
% Rank:
9
-2.770B
Peer Group Low
3.054B
Peer Group High
Date Unavailable
Risk
Performance Versus Peer Group
Annual Total Returns Versus Peers
As of June 10, 2026.
Asset Allocation
As of March 31, 2026.
| Type | % Net |
|---|---|
| Cash | 5.00% |
| Stock | 98.13% |
| Bond | 0.44% |
| Convertible | 0.00% |
| Preferred | 0.00% |
| Other | -3.57% |
Top 10 Holdings
| Name | % Weight | Price | % Change |
|---|---|---|---|
| Welltower, Inc. | 3.96% | 211.38 | 2.23% |
| Prologis, Inc. | 3.48% | 145.76 | -1.19% |
| Equinix, Inc. | 3.00% | 1038.55 | -2.01% |
| Exxon Mobil Corp. | 2.63% | 150.66 | 1.18% |
|
USD Cash
|
2.18% | -- | -- |
| Chevron Corp. | 2.11% | 189.79 | 1.62% |
|
Goldman Sachs & Co Inc REPO
|
2.02% | -- | -- |
| Simon Property Group, Inc. | 1.92% | 212.82 | 0.44% |
| Shell Plc | 1.86% | 43.40 | 2.04% |
| Canadian Natural Resources Ltd. | 1.71% | 45.53 | 1.61% |
Fees & Availability
| Fees | |
| Actual 12B-1 Fee | 0.07% |
| Actual Management Fee | 0.79% |
| Administration Fee | -- |
| Maximum Front Load | -- |
| Maximum Deferred Load | -- |
| Maximum Redemption Fee | -- |
| General Availability | |
| Available for Insurance Product | No |
| Available for RRSP | No |
| Purchase Details | |
| Open to New Investors |
|
| Minimum Initial Investment | 0.00 None |
| Minimum Subsequent Investment | 0.00 None |
Basic Info
| Investment Strategy | |
| The Fund seeks a long-term total return in excess of inflation. The fund invests at least 80% of its net assets in securities of real asset companies worldwide which include real estate companies, natural resources companies, infrastructure companies, master limited partnerships, and agriculture and timber companies. |
| General | |
| Security Type | Mutual Fund |
| Equity Style | Multi Cap Value |
| Broad Asset Class | Allocation |
| Broad Category | Allocation |
| Global Peer Group | Mixed Asset USD Flexible - Global |
| Peer Group | Real Return Funds |
| Global Macro | Mixed Asset HC Flexible |
| US Macro | Mixed-Assets Funds |
| YCharts Categorization | -- |
| YCharts Benchmark | -- |
| Prospectus Objective | Real Return Funds |
| Fund Owner Firm Name | John Hancock Group |
| Broad Asset Class Benchmark Index | |
| ^SPXTR | 100.0% |
Fundamentals
| General | |
| Distribution Yield | -- |
| Dividend Yield TTM (6-8-26) | 3.70% |
| 30-Day SEC Yield | -- |
| 7-Day SEC Yield | -- |
| Number of Holdings | 306 |
| Stock | |
| Weighted Average PE Ratio | 27.75 |
| Weighted Average Price to Sales Ratio | 6.184 |
| Weighted Average Price to Book Ratio | 3.624 |
| Weighted Median ROE | 10.72% |
| Weighted Median ROA | 5.24% |
| ROI (TTM) | 8.45% |
| Return on Investment (TTM) | 8.45% |
| Earning Yield | 0.0457 |
| LT Debt / Shareholders Equity | 0.7464 |
| Number of Equity Holdings | 298 |
As of March 31, 2026
Growth Metrics
| EPS Growth (1Y) | 22.43% |
| EPS Growth (3Y) | 7.74% |
| EPS Growth (5Y) | 14.92% |
| Sales Growth (1Y) | 12.07% |
| Sales Growth (3Y) | 5.15% |
| Sales Growth (5Y) | 12.57% |
| Sales per Share Growth (1Y) | 41.93% |
| Sales per Share Growth (3Y) | 2.58% |
| Operating Cash Flow - Growth Rate (3Y) | 11.71% |
As of March 31, 2026
Fund Details
| Key Dates | |
| Inception Date | 2/26/2018 |
| Last Annual Report Date | 3/31/2025 |
| Last Prospectus Date | 8/1/2025 |
| Attributes | |
| Index Fund | -- |
| Inverse Fund | No |
| Leveraged Fund | -- |
| Fund of Funds | No |
| Currency Hedged Fund | -- |
| Socially Responsible Fund | No |
Top Portfolio Holders
| Name | % Weight |
|---|---|
| Portfolio A | 5.00% |
| Portfolio B | 3.50% |
| Portfolio C | 2.25% |
Excel Add-In Codes
| Name: =YCI("M:LP40223122", "name") |
| Broad Asset Class: =YCI("M:LP40223122", "broad_asset_class") |
| Broad Category: =YCI("M:LP40223122", "broad_category_group") |
| Prospectus Objective: =YCI("M:LP40223122", "prospectus_objective") |
| To find the codes for any of our securities and financial metrics, see our Complete Excel Reference. |