

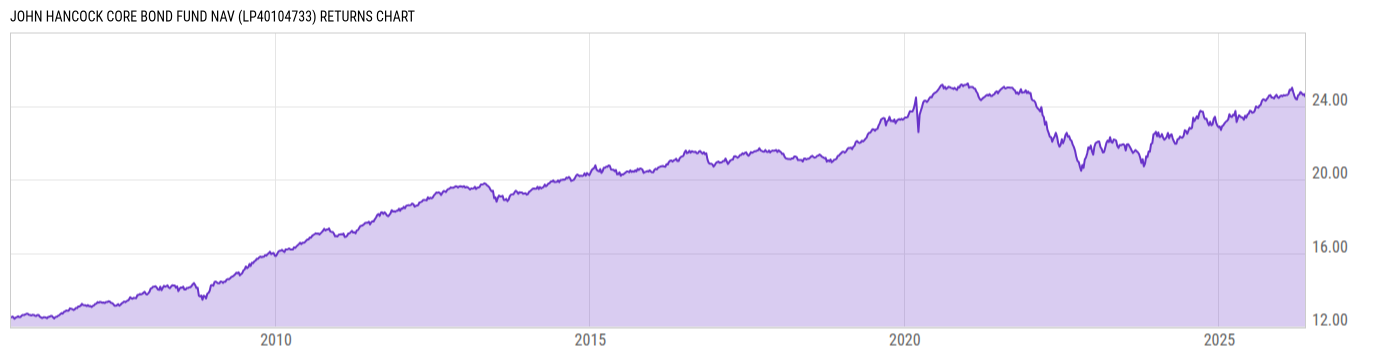
John Hancock Core Bond Fund NAV (LP40104733)
10.96
-0.02
(-0.18%)
USD |
Jun 03 2026
Returns Chart
Key Stats
| Net Expense Ratio | Total Assets Under Management | Weighted Average Dividend Yield | Turnover Ratio (Generic) |
|---|---|---|---|
| 0.61% | 1.688B | -- | 240.0% |
| 1 Year Fund Level Flows | 1 Year Total Returns (Daily) | Annualized Total Returns Since Inception (Daily) | Max Drawdown (Since Inception) |
| -134.31M | 5.02% |
Basic Info
| Investment Strategy | |
| The Fund seeks total return consisting of income and capital appreciation. The fund invests at least 80% of its net assets in a broad range of investment-grade debt securities, including US government obligations, corporate bonds, mortgage-backed and other asset-backed securities and money market instruments. |
| General | |
| Security Type | Mutual Fund |
| Equity Style | -- |
| Broad Asset Class | Taxable Bond |
| Broad Category | Fixed Income |
| Global Peer Group | Bond USD Medium Term |
| Peer Group | Core Bond Funds |
| Global Macro | Bond HC |
| US Macro | Short/Intermediate Investment-Grade Funds |
| YCharts Categorization | -- |
| YCharts Benchmark | -- |
| Prospectus Objective | Core Bond Funds |
| Fund Owner Firm Name | John Hancock Group |
| Broad Asset Class Benchmark Index | |
| ^BBUSATR | 100.0% |
Net Fund Flows Versus Peer Group
1 Month
% Rank:
30
-1.041B
Peer Group Low
3.949B
Peer Group High
1 Year
% Rank:
78
-134.31M
-5.263B
Peer Group Low
53.52B
Peer Group High
3 Months
% Rank:
37
-2.855B
Peer Group Low
7.925B
Peer Group High
3 Years
% Rank:
80
-14.12B
Peer Group Low
93.39B
Peer Group High
6 Months
% Rank:
50
-5.233B
Peer Group Low
25.53B
Peer Group High
5 Years
% Rank:
67
-16.57B
Peer Group Low
119.13B
Peer Group High
YTD
% Rank:
40
-5.213B
Peer Group Low
20.55B
Peer Group High
10 Years
% Rank:
73
-15.49B
Peer Group Low
244.84B
Peer Group High
Date Unavailable
Risk
Performance Versus Peer Group
Annual Total Returns Versus Peers
As of June 04, 2026.
Asset Allocation
As of March 31, 2026.
| Type | % Net |
|---|---|
| Cash | 0.85% |
| Stock | 0.00% |
| Bond | 101.3% |
| Convertible | 0.00% |
| Preferred | 0.00% |
| Other | -2.16% |
Top 10 Holdings
| Name | % Weight | Price | % Change |
|---|---|---|---|
| United States of America USGB 3.875 03/31/2028 FIX USD Government | 4.39% | 99.65 | -0.05% |
| State Street US Government Money Market Fund Prem | 3.46% | 1.00 | 0.00% |
| United States of America USGB 3.875 03/31/2031 FIX USD Government | 2.56% | 98.70 | -0.13% |
| United States of America USGB 2.0 11/15/2041 FIX USD Government | 1.75% | 68.68 | -0.39% |
| United States of America USGB 4.625 11/15/2055 FIX USD Government | 1.47% | 94.29 | -0.33% |
| United States of America USGB 3.875 04/30/2030 FIX USD Government | 1.46% | 98.92 | -0.12% |
| United States of America USGB 3.625 12/31/2030 FIX USD Government | 1.21% | 97.62 | -0.14% |
| United States of America USGB 4.625 02/15/2046 FIX USD Government | 1.19% | 95.29 | -0.36% |
| United States of America USGB 3.75 06/30/2030 FIX USD Government | 1.14% | 98.38 | -0.13% |
|
Federal National Mortgage Association 5.5% 01-MAY-2056
|
0.99% | -- | -- |
Fees & Availability
| Fees | |
| Actual 12B-1 Fee | -- |
| Actual Management Fee | 0.57% |
| Administration Fee | -- |
| Maximum Front Load | -- |
| Maximum Deferred Load | -- |
| Maximum Redemption Fee | -- |
| General Availability | |
| Available for Insurance Product | No |
| Available for RRSP | No |
| Purchase Details | |
| Open to New Investors |
|
| Minimum Initial Investment | 0.00 None |
| Minimum Subsequent Investment | 0.00 None |
Basic Info
| Investment Strategy | |
| The Fund seeks total return consisting of income and capital appreciation. The fund invests at least 80% of its net assets in a broad range of investment-grade debt securities, including US government obligations, corporate bonds, mortgage-backed and other asset-backed securities and money market instruments. |
| General | |
| Security Type | Mutual Fund |
| Equity Style | -- |
| Broad Asset Class | Taxable Bond |
| Broad Category | Fixed Income |
| Global Peer Group | Bond USD Medium Term |
| Peer Group | Core Bond Funds |
| Global Macro | Bond HC |
| US Macro | Short/Intermediate Investment-Grade Funds |
| YCharts Categorization | -- |
| YCharts Benchmark | -- |
| Prospectus Objective | Core Bond Funds |
| Fund Owner Firm Name | John Hancock Group |
| Broad Asset Class Benchmark Index | |
| ^BBUSATR | 100.0% |
Fundamentals
| General | |
| Distribution Yield | -- |
| Dividend Yield TTM (6-3-26) | 4.19% |
| 30-Day SEC Yield (5-31-14) | 2.41% |
| 7-Day SEC Yield | -- |
| Number of Holdings | 1024 |
| Bond | |
| Yield to Maturity (3-31-26) | 4.73% |
| Effective Duration | 0.13 |
| Average Coupon | 4.08% |
| Calculated Average Quality | 2.287 |
| Effective Maturity | 15.83 |
| Nominal Maturity | 15.84 |
| Number of Bond Holdings | 995 |
As of March 31, 2026
Fund Details
| Key Dates | |
| Inception Date | 10/15/2005 |
| Last Annual Report Date | 8/31/2025 |
| Last Prospectus Date | 1/1/2026 |
| Share Classes | |
| JICDX | Other |
| Attributes | |
| Index Fund | -- |
| Inverse Fund | No |
| Leveraged Fund | -- |
| Fund of Funds | No |
| Currency Hedged Fund | -- |
| Socially Responsible Fund | No |
Top Portfolio Holders
| Name | % Weight |
|---|---|
| Portfolio A | 5.00% |
| Portfolio B | 3.50% |
| Portfolio C | 2.25% |
Excel Add-In Codes
| Name: =YCI("M:LP40104733", "name") |
| Broad Asset Class: =YCI("M:LP40104733", "broad_asset_class") |
| Broad Category: =YCI("M:LP40104733", "broad_category_group") |
| Prospectus Objective: =YCI("M:LP40104733", "prospectus_objective") |
| To find the codes for any of our securities and financial metrics, see our Complete Excel Reference. |