

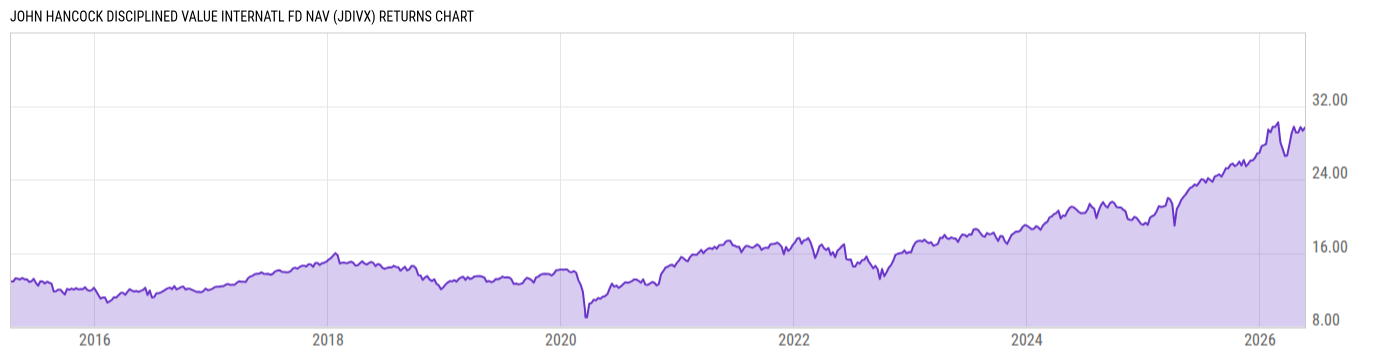
John Hancock Disciplined Value Internatl Fd NAV (JDIVX)
18.43
-0.07
(-0.38%)
USD |
May 22 2026
Returns Chart
Key Stats
| Net Expense Ratio | Total Assets Under Management | Weighted Average Dividend Yield | Turnover Ratio (Generic) |
|---|---|---|---|
| 0.73% | 6.765B | 2.47% | 81.00% |
| 1 Year Fund Level Flows | 1 Year Total Returns (Daily) | Annualized Total Returns Since Inception (Daily) | Max Drawdown (Since Inception) |
| 119.44M | 30.27% |
Basic Info
| Investment Strategy | |
| The Fund seeks long-term capital growth. The Fund invests at least 80% of its net assets in a portfolio of equity and equity-related securities issued by non-U.S. companies of any capitalization size. It invests in the equity securities of issuers believed by the sub advisor to be undervalued in the marketplace. |
| General | |
| Security Type | Mutual Fund |
| Equity Style | Multi Cap Value |
| Broad Asset Class | International Equity |
| Broad Category | Equity |
| Global Peer Group | Equity Global ex US |
| Peer Group | International Multi-Cap Value |
| Global Macro | Equity Global |
| US Macro | Developed International Markets Funds |
| YCharts Categorization | -- |
| YCharts Benchmark | -- |
| Prospectus Objective | International Funds |
| Fund Owner Firm Name | John Hancock Group |
| Broad Asset Class Benchmark Index | |
| ^MSACXUSNTR | 100.0% |
Net Fund Flows Versus Peer Group
1 Month
% Rank:
95
-368.23M
Peer Group Low
353.24M
Peer Group High
1 Year
% Rank:
28
119.44M
-3.471B
Peer Group Low
3.593B
Peer Group High
3 Months
% Rank:
40
-1.075B
Peer Group Low
1.392B
Peer Group High
3 Years
% Rank:
10
-11.47B
Peer Group Low
7.008B
Peer Group High
6 Months
% Rank:
61
-1.774B
Peer Group Low
2.281B
Peer Group High
5 Years
% Rank:
13
-16.46B
Peer Group Low
8.528B
Peer Group High
YTD
% Rank:
87
-1.329B
Peer Group Low
1.787B
Peer Group High
10 Years
% Rank:
10
-22.22B
Peer Group Low
8.108B
Peer Group High
Date Unavailable
Risk
Performance Versus Peer Group
Annual Total Returns Versus Peers
As of May 23, 2026.
Asset Allocation
As of March 31, 2026.
| Type | % Net |
|---|---|
| Cash | 4.08% |
| Stock | 92.53% |
| Bond | 2.40% |
| Convertible | 0.00% |
| Preferred | 0.81% |
| Other | 0.18% |
Top 10 Holdings
| Name | % Weight | Price | % Change |
|---|---|---|---|
| Fidelity Instl Government Portfolio Institutional | 4.49% | 1.00 | 0.00% |
| The Weir Group Plc | 2.80% | 32.65 | -3.49% |
| Samsung Electronics Co., Ltd. | 2.65% | 140.00 | 0.00% |
| Danske Bank A/S | 2.39% | 51.00 | 0.00% |
| Euronext NV | 2.38% | 174.07 | -1.71% |
| Saipem SpA | 2.34% | 4.90 | -10.91% |
| Shell Plc | 2.03% | 44.25 | 1.33% |
| AstraZeneca PLC | 2.01% | 187.03 | -1.43% |
|
USD Cash
|
1.99% | -- | -- |
| Roche Holding AG | 1.88% | 425.00 | 0.56% |
Fees & Availability
| Fees | |
| Actual 12B-1 Fee | -- |
| Actual Management Fee | 0.66% |
| Administration Fee | -- |
| Maximum Front Load | -- |
| Maximum Deferred Load | -- |
| Maximum Redemption Fee | -- |
| General Availability | |
| Available for Insurance Product | No |
| Available for RRSP | No |
| Purchase Details | |
| Open to New Investors |
|
| Minimum Initial Investment | 0.00 None |
| Minimum Subsequent Investment | 0.00 None |
Basic Info
| Investment Strategy | |
| The Fund seeks long-term capital growth. The Fund invests at least 80% of its net assets in a portfolio of equity and equity-related securities issued by non-U.S. companies of any capitalization size. It invests in the equity securities of issuers believed by the sub advisor to be undervalued in the marketplace. |
| General | |
| Security Type | Mutual Fund |
| Equity Style | Multi Cap Value |
| Broad Asset Class | International Equity |
| Broad Category | Equity |
| Global Peer Group | Equity Global ex US |
| Peer Group | International Multi-Cap Value |
| Global Macro | Equity Global |
| US Macro | Developed International Markets Funds |
| YCharts Categorization | -- |
| YCharts Benchmark | -- |
| Prospectus Objective | International Funds |
| Fund Owner Firm Name | John Hancock Group |
| Broad Asset Class Benchmark Index | |
| ^MSACXUSNTR | 100.0% |
Fundamentals
| General | |
| Distribution Yield | -- |
| Dividend Yield TTM (5-21-26) | 2.32% |
| 30-Day SEC Yield | -- |
| 7-Day SEC Yield | -- |
| Number of Holdings | 95 |
| Stock | |
| Weighted Average PE Ratio | 20.61 |
| Weighted Average Price to Sales Ratio | 2.666 |
| Weighted Average Price to Book Ratio | 2.797 |
| Weighted Median ROE | 14.59% |
| Weighted Median ROA | 5.30% |
| ROI (TTM) | 10.13% |
| Return on Investment (TTM) | 10.13% |
| Earning Yield | 0.0623 |
| LT Debt / Shareholders Equity | 0.7291 |
| Number of Equity Holdings | 89 |
As of March 31, 2026
Growth Metrics
| EPS Growth (1Y) | 20.27% |
| EPS Growth (3Y) | 13.69% |
| EPS Growth (5Y) | 16.31% |
| Sales Growth (1Y) | 8.32% |
| Sales Growth (3Y) | 6.03% |
| Sales Growth (5Y) | 9.51% |
| Sales per Share Growth (1Y) | 8.90% |
| Sales per Share Growth (3Y) | 6.09% |
| Operating Cash Flow - Growth Rate (3Y) | 14.01% |
As of March 31, 2026
Fund Details
| Key Dates | |
| Inception Date | 4/13/2015 |
| Last Annual Report Date | 10/31/2025 |
| Last Prospectus Date | 3/1/2026 |
| Share Classes | |
| JDIBX | A |
| JDICX | C |
| JDISX | Retirement |
| JDITX | Retirement |
| JDIUX | Retirement |
| JDVIX | Inst |
| Attributes | |
| Index Fund | -- |
| Inverse Fund | No |
| Leveraged Fund | -- |
| Fund of Funds | No |
| Currency Hedged Fund | -- |
| Socially Responsible Fund | No |
Top Portfolio Holders
| Name | % Weight |
|---|---|
| Portfolio A | 5.00% |
| Portfolio B | 3.50% |
| Portfolio C | 2.25% |
Excel Add-In Codes
| Name: =YCI("M:JDIVX", "name") |
| Broad Asset Class: =YCI("M:JDIVX", "broad_asset_class") |
| Broad Category: =YCI("M:JDIVX", "broad_category_group") |
| Prospectus Objective: =YCI("M:JDIVX", "prospectus_objective") |
| To find the codes for any of our securities and financial metrics, see our Complete Excel Reference. |