

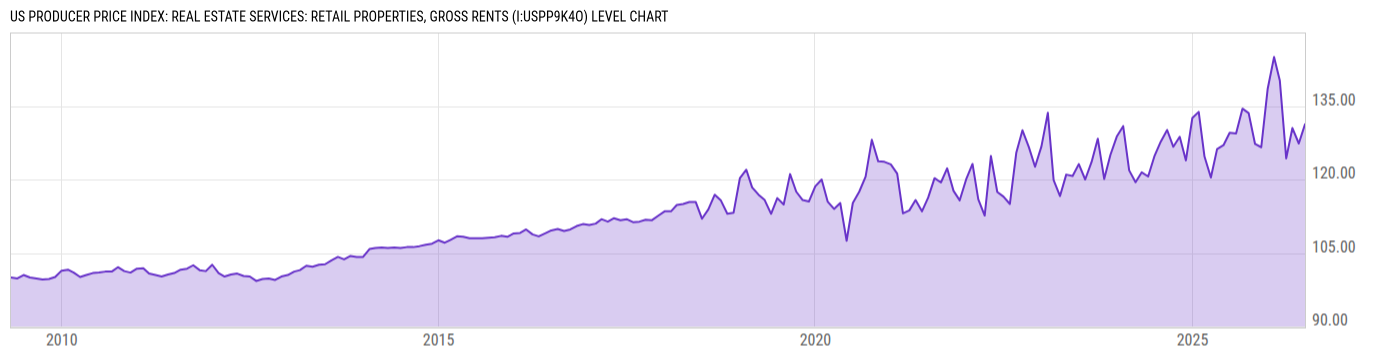
US Producer Price Index: Real Estate Services: Retail Properties, Gross Rents (I:USPP9K4O)
131.27 for Jun 2026
Level Chart
Basic Info
|
US Producer Price Index: Real Estate Services: Retail Properties, Gross Rents is at a current level of 131.27, up from 127.35 last month and up from 129.55 one year ago. This is a change of 3.08% from last month and 1.33% from one year ago. |
| Report | Producer Price Index |
| Category | Producer Prices |
| Region | United States |
| Source | Bureau of Labor Statistics |
Stats
| Last Value | 131.27 |
| Latest Period | Jun 2026 |
| Last Updated | Jul 15 2026, 11:47 EDT |
| Next Release | Aug 13 2026, 08:30 EDT |
| Average Growth Rate | 2.05% |
| Value from Last Month | 127.35 |
| Change from Last Month | 3.08% |
| Value from 1 Year Ago | 129.55 |
| Change from 1 Year Ago | 1.33% |
| Frequency | Monthly |
| Unit | Index April 2009=100 |
| Adjustment | Not Seasonally Adjusted |
| Download Source File | |
| Notes | Partial |
Historical Data
| Date | Value |
|---|---|
| June 30, 2026 | 131.27 |
| May 31, 2026 | 127.35 |
| April 30, 2026 | 130.50 |
| March 31, 2026 | 124.31 |
| February 28, 2026 | 140.20 |
| January 31, 2026 | 144.98 |
| December 31, 2025 | 138.46 |
| November 30, 2025 | 126.58 |
| October 31, 2025 | 127.26 |
| September 30, 2025 | 133.56 |
| August 31, 2025 | 134.46 |
| July 31, 2025 | 129.41 |
| June 30, 2025 | 129.55 |
| May 31, 2025 | 127.00 |
| April 30, 2025 | 126.21 |
| March 31, 2025 | 120.42 |
| February 28, 2025 | 124.69 |
| January 31, 2025 | 133.81 |
| December 31, 2024 | 132.54 |
| November 30, 2024 | 123.90 |
| October 31, 2024 | 128.71 |
| September 30, 2024 | 126.67 |
| August 31, 2024 | 130.11 |
| July 31, 2024 | 127.71 |
| June 30, 2024 | 124.71 |
| Date | Value |
|---|---|
| May 31, 2024 | 120.61 |
| April 30, 2024 | 121.46 |
| March 31, 2024 | 119.45 |
| February 29, 2024 | 121.87 |
| January 31, 2024 | 130.88 |
| December 31, 2023 | 128.76 |
| November 30, 2023 | 125.00 |
| October 31, 2023 | 120.12 |
| September 30, 2023 | 128.34 |
| August 31, 2023 | 123.58 |
| July 31, 2023 | 120.00 |
| June 30, 2023 | 123.13 |
| May 31, 2023 | 120.70 |
| April 30, 2023 | 121.00 |
| March 31, 2023 | 116.62 |
| February 28, 2023 | 119.88 |
| January 31, 2023 | 133.60 |
| December 31, 2022 | 126.75 |
| November 30, 2022 | 122.61 |
| October 31, 2022 | 126.60 |
| September 30, 2022 | 130.04 |
| August 31, 2022 | 125.46 |
| July 31, 2022 | 115.00 |
| June 30, 2022 | 116.50 |
| May 31, 2022 | 117.46 |
News
Headline
Time (ET)
06/23 12:02
Basic Info
|
US Producer Price Index: Real Estate Services: Retail Properties, Gross Rents is at a current level of 131.27, up from 127.35 last month and up from 129.55 one year ago. This is a change of 3.08% from last month and 1.33% from one year ago. |
| Report | Producer Price Index |
| Category | Producer Prices |
| Region | United States |
| Source | Bureau of Labor Statistics |
Stats
| Last Value | 131.27 |
| Latest Period | Jun 2026 |
| Last Updated | Jul 15 2026, 11:47 EDT |
| Next Release | Aug 13 2026, 08:30 EDT |
| Average Growth Rate | 2.05% |
| Value from Last Month | 127.35 |
| Change from Last Month | 3.08% |
| Value from 1 Year Ago | 129.55 |
| Change from 1 Year Ago | 1.33% |
| Frequency | Monthly |
| Unit | Index April 2009=100 |
| Adjustment | Not Seasonally Adjusted |
| Download Source File | |
| Notes | Partial |
Related Indicators
| US Commercial Real Estate |