

NAHB Multifamily Occupancy Index (I:NAHBMOUQ)
74.32 for Q3 2025
Level Chart
Basic Info
|
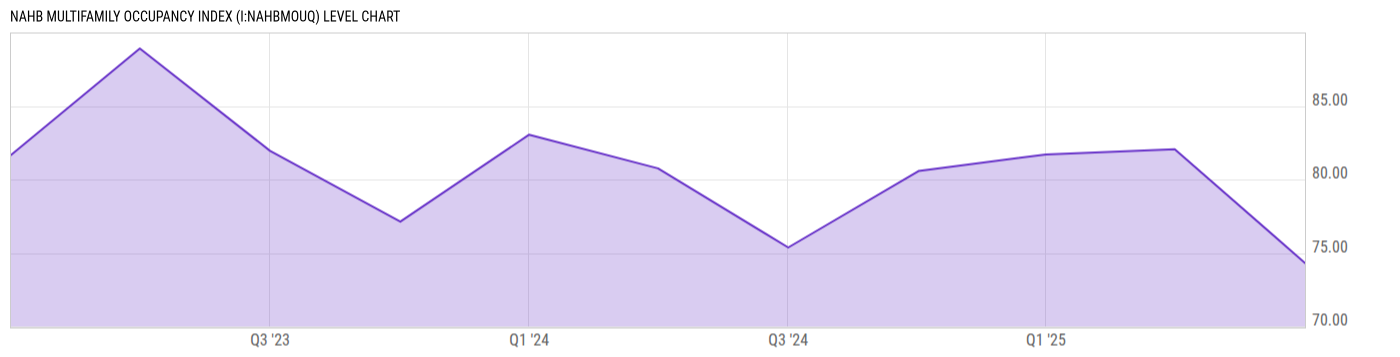
NAHB Multifamily Occupancy Index is at a current level of 74.32, down from 82.06 last quarter and down from 75.37 one year ago. This is a change of -9.43% from last quarter and -1.40% from one year ago. |
| Report | NAHB Multifamily Market Survey |
| Category | Construction |
| Region | United States |
| Source | National Association of Home Builders |
Stats
| Last Value | 74.32 |
| Latest Period | Sep 2025 |
| Last Updated | Nov 6 2025, 17:29 EST |
| Next Release | Aug 6 2026, 08:00 EDT |
| Average Growth Rate | -2.91% |
| Value from Last Quarter | 82.06 |
| Change from Last Quarter | -9.43% |
| Value from 1 Year Ago | 75.37 |
| Change from 1 Year Ago | -1.40% |
| Frequency | Quarterly |
| Adjustment | Not Seasonally Adjusted |
| Download Source File | |
| Notes | The overall Multifamily Occupancy Index is a weighted average of the 3 components: 0.60×Garden/Low-Rise + 0.25×Mid/High-Rise + 0.15×Subsidized The weights are derived from a statistical analysis of the relationship between the components and the American Housing Survey (AHS). |
Historical Data
| Date | Value |
|---|---|
| September 30, 2025 | 74.32 |
| June 30, 2025 | 82.06 |
| March 31, 2025 | 81.71 |
| December 31, 2024 | 80.58 |
| September 30, 2024 | 75.37 |
| June 30, 2024 | 80.75 |
| Date | Value |
|---|---|
| March 31, 2024 | 83.05 |
| December 31, 2023 | 77.13 |
| September 30, 2023 | 81.95 |
| June 30, 2023 | 88.91 |
| March 31, 2023 | 81.67 |
News
Headline
Time (ET)
07/16 12:00
07/16 08:37
Basic Info
|
NAHB Multifamily Occupancy Index is at a current level of 74.32, down from 82.06 last quarter and down from 75.37 one year ago. This is a change of -9.43% from last quarter and -1.40% from one year ago. |
| Report | NAHB Multifamily Market Survey |
| Category | Construction |
| Region | United States |
| Source | National Association of Home Builders |
Stats
| Last Value | 74.32 |
| Latest Period | Sep 2025 |
| Last Updated | Nov 6 2025, 17:29 EST |
| Next Release | Aug 6 2026, 08:00 EDT |
| Average Growth Rate | -2.91% |
| Value from Last Quarter | 82.06 |
| Change from Last Quarter | -9.43% |
| Value from 1 Year Ago | 75.37 |
| Change from 1 Year Ago | -1.40% |
| Frequency | Quarterly |
| Adjustment | Not Seasonally Adjusted |
| Download Source File | |
| Notes | The overall Multifamily Occupancy Index is a weighted average of the 3 components: 0.60×Garden/Low-Rise + 0.25×Mid/High-Rise + 0.15×Subsidized The weights are derived from a statistical analysis of the relationship between the components and the American Housing Survey (AHS). |
Related Indicators
| US Commercial Real Estate |