

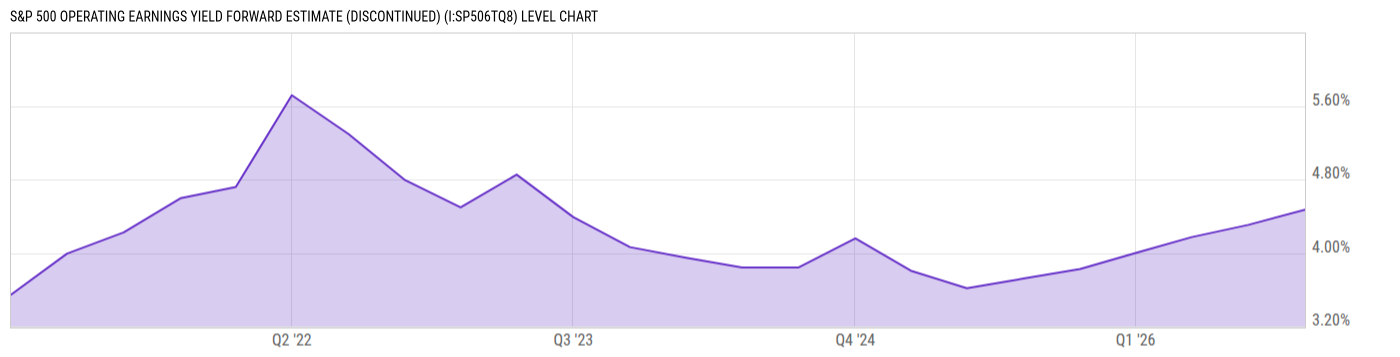
S&P 500 Operating Earnings Yield Forward Estimate (DISCONTINUED) (I:SP506TQ8)
4.47% for Q4 2026
Level Chart
Basic Info
|
S&P 500 Operating Earnings Yield Forward Estimate is at 4.47%, compared to 4.31% last quarter and 3.80% last year. This is higher than the long term average of 4.26%. |
|
None |
| Report | S&P 500 Earnings |
| Categories | N/A |
| Region | United States |
| Source | Standard and Poor's |
Stats
| Last Value | 4.47% |
| Latest Period | Dec 2026 |
| Last Updated | Feb 2 2026, 13:19 EST |
| Long Term Average | 4.26% |
| Average Growth Rate | 5.18% |
| Value from Last Quarter | 4.31% |
| Change from Last Quarter | 3.83% |
| Value from 1 Year Ago | 3.80% |
| Change from 1 Year Ago | 17.76% |
| Frequency | Quarterly |
| Unit | Percent |
| Adjustment | N/A |
| Download Source File |
Historical Data
| Date | Value |
|---|---|
| December 31, 2026 | 4.47% |
| September 30, 2026 | 4.31% |
| June 30, 2026 | 4.17% |
| March 31, 2026 | 4.00% |
| December 31, 2025 | 3.82% |
| September 30, 2025 | 3.72% |
| June 30, 2025 | 3.62% |
| March 31, 2025 | 3.81% |
| December 31, 2024 | 4.16% |
| September 30, 2024 | 3.84% |
| June 30, 2024 | 3.84% |
| March 31, 2024 | 3.95% |
| Date | Value |
|---|---|
| December 31, 2023 | 4.06% |
| September 30, 2023 | 4.39% |
| June 30, 2023 | 4.85% |
| March 31, 2023 | 4.50% |
| December 31, 2022 | 4.79% |
| September 30, 2022 | 5.30% |
| June 30, 2022 | 5.72% |
| March 31, 2022 | 4.72% |
| December 31, 2021 | 4.60% |
| September 30, 2021 | 4.22% |
| June 30, 2021 | 3.99% |
| March 31, 2021 | 3.55% |
News
Headline
Time (ET)
06/01 16:03
06/01 12:12
Basic Info
|
S&P 500 Operating Earnings Yield Forward Estimate is at 4.47%, compared to 4.31% last quarter and 3.80% last year. This is higher than the long term average of 4.26%. |
|
None |
| Report | S&P 500 Earnings |
| Categories | N/A |
| Region | United States |
| Source | Standard and Poor's |
Stats
| Last Value | 4.47% |
| Latest Period | Dec 2026 |
| Last Updated | Feb 2 2026, 13:19 EST |
| Long Term Average | 4.26% |
| Average Growth Rate | 5.18% |
| Value from Last Quarter | 4.31% |
| Change from Last Quarter | 3.83% |
| Value from 1 Year Ago | 3.80% |
| Change from 1 Year Ago | 17.76% |
| Frequency | Quarterly |
| Unit | Percent |
| Adjustment | N/A |
| Download Source File |
Related Indicators
| S&P 500 Fundamentals |
| S&P 500 Dividend Yield (DISCONTINUED) | 1.15% |
| S&P 500 Earnings Yield (DISCONTINUED) | 3.50% |
| S&P 500 Market Cap (DISCONTINUED) | 58.44T USD |
| S&P 500 P/E Ratio (DISCONTINUED) | 28.58 |
| S&P 500 Price to Book Ratio (DISCONTINUED) | 5.265 |
| S&P 500 Shiller CAPE Ratio | 39.58 |
| SPX Put/Call Ratio | 1.17 |
| VIX | 15.77 |
| S&P 500 Returns |