

6 Month Treasury Rate (I:6MTCMR)
Level Chart
Basic Info
|
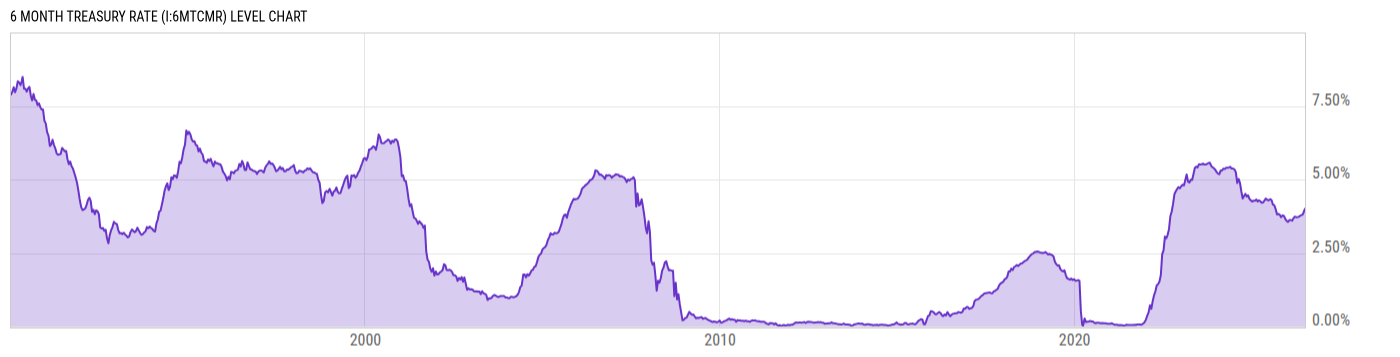
6 Month Treasury Rate is at 4.05%, compared to 4.02% the previous market day and 4.30% last year. This is higher than the long term average of 2.92%. |
|
The 6 Month Treasury Bill Rate is the yield received for investing in a US government issued treasury security that has a maturity of 6 months. The 6 month treasury yield is included on the shorter end of the yield curve. The 6 month treasury yield reached nearly 16% in 1981, as the Fed was raising its benchmark rates in an effort to curb inflation. Track the full US Treasury yield curve with our Yield Curve Tool. |
| Report | Daily Treasury Yield Curve Rates |
| Category | Interest Rates |
| Region | United States |
| Source | Department of the Treasury |
Stats
| Last Value | 4.05% |
| Latest Period | Jul 22 2026 |
| Last Updated | Jul 22 2026, 18:03 EDT |
| Next Release | Jul 23 2026, 18:00 EDT |
| Long Term Average | 2.92% |
| Average Growth Rate | 60.66% |
| Value from The Previous Market Day | 4.02% |
| Change from The Previous Market Day | 0.75% |
| Value from 1 Year Ago | 4.30% |
| Change from 1 Year Ago | -5.81% |
| Frequency | Market Daily |
| Unit | Percent |
| Adjustment | N/A |
| Download Source File |
Historical Data
| Date | Value |
|---|---|
| July 22, 2026 | 4.05% |
| July 21, 2026 | 4.02% |
| July 20, 2026 | 4.00% |
| July 17, 2026 | 3.96% |
| July 16, 2026 | 3.94% |
| July 15, 2026 | 3.93% |
| July 14, 2026 | 3.95% |
| July 13, 2026 | 4.03% |
| July 10, 2026 | 3.99% |
| July 09, 2026 | 3.96% |
| July 08, 2026 | 3.99% |
| July 07, 2026 | 3.99% |
| July 06, 2026 | 3.98% |
| July 02, 2026 | 3.98% |
| July 01, 2026 | 4.00% |
| June 30, 2026 | 4.01% |
| June 29, 2026 | 4.00% |
| June 26, 2026 | 3.94% |
| June 25, 2026 | 3.95% |
| June 24, 2026 | 3.95% |
| June 23, 2026 | 3.96% |
| June 22, 2026 | 3.98% |
| June 18, 2026 | 3.92% |
| June 17, 2026 | 3.91% |
| June 16, 2026 | 3.81% |
| Date | Value |
|---|---|
| June 15, 2026 | 3.81% |
| June 12, 2026 | 3.82% |
| June 11, 2026 | 3.81% |
| June 10, 2026 | 3.82% |
| June 09, 2026 | 3.82% |
| June 08, 2026 | 3.83% |
| June 05, 2026 | 3.81% |
| June 04, 2026 | 3.78% |
| June 03, 2026 | 3.78% |
| June 02, 2026 | 3.78% |
| June 01, 2026 | 3.79% |
| May 29, 2026 | 3.78% |
| May 28, 2026 | 3.79% |
| May 27, 2026 | 3.79% |
| May 26, 2026 | 3.80% |
| May 22, 2026 | 3.79% |
| May 21, 2026 | 3.78% |
| May 20, 2026 | 3.75% |
| May 19, 2026 | 3.77% |
| May 18, 2026 | 3.77% |
| May 15, 2026 | 3.77% |
| May 14, 2026 | 3.76% |
| May 13, 2026 | 3.77% |
| May 12, 2026 | 3.77% |
| May 11, 2026 | 3.77% |
News
Basic Info
|
6 Month Treasury Rate is at 4.05%, compared to 4.02% the previous market day and 4.30% last year. This is higher than the long term average of 2.92%. |
|
The 6 Month Treasury Bill Rate is the yield received for investing in a US government issued treasury security that has a maturity of 6 months. The 6 month treasury yield is included on the shorter end of the yield curve. The 6 month treasury yield reached nearly 16% in 1981, as the Fed was raising its benchmark rates in an effort to curb inflation. Track the full US Treasury yield curve with our Yield Curve Tool. |
| Report | Daily Treasury Yield Curve Rates |
| Category | Interest Rates |
| Region | United States |
| Source | Department of the Treasury |
Stats
| Last Value | 4.05% |
| Latest Period | Jul 22 2026 |
| Last Updated | Jul 22 2026, 18:03 EDT |
| Next Release | Jul 23 2026, 18:00 EDT |
| Long Term Average | 2.92% |
| Average Growth Rate | 60.66% |
| Value from The Previous Market Day | 4.02% |
| Change from The Previous Market Day | 0.75% |
| Value from 1 Year Ago | 4.30% |
| Change from 1 Year Ago | -5.81% |
| Frequency | Market Daily |
| Unit | Percent |
| Adjustment | N/A |
| Download Source File |
Related Indicators
| Treasury Yield Curve |
| 1 Month Treasury Rate | 3.76% |
| 1 Year Treasury Rate | 4.11% |
| 10 Year Treasury Rate | 4.67% |
| 10 Year-3 Month Treasury Yield Spread | 0.78% |
| 10-2 Year Treasury Yield Spread | 0.36% |
| 20 Year Treasury Rate | 5.17% |
| 3 Month Treasury Rate | 3.89% |
| 3 Year Treasury Rate | 4.34% |
| 30 Year Treasury Rate | 5.15% |
| 30-10 Year Treasury Yield Spread | 0.48% |
| 5 Year Treasury Rate | 4.41% |
| 7 Year Treasury Rate | 4.53% |