

10 Year-3 Month Treasury Yield Spread (I:10Y3MTS)
Level Chart
Basic Info
|
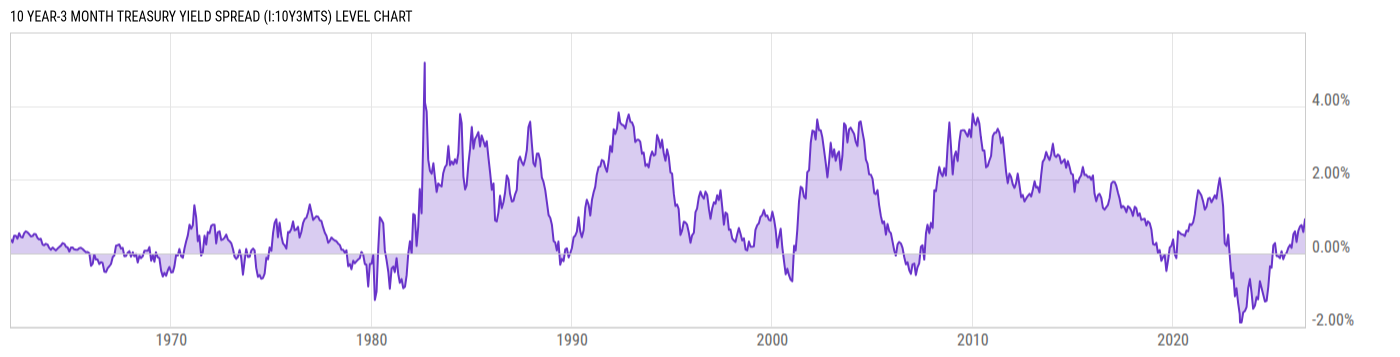
10 Year-3 Month Treasury Yield Spread is at 0.92%, compared to 0.86% the previous market day and -0.04% last year. This is lower than the long term average of 1.10%. |
|
The 10 Year-3 Month Treasury Yield Spread is the difference between the 10 year treasury rate and the 3 month treasury rate. This spread is widely used as a gauge to study the yield curve. A 10 year-3 month treasury spread that approaches 0 signifies a "flattening" yield curve. Furthermore, a negative 10 year-3 month spread has historically been viewed as a precursor or predictor of a recessionary period. The New York Fed uses the rate in a model to predict recessions 2 to 6 quarters ahead. Track the full US Treasury yield curve with our Yield Curve Tool. |
| Report | Daily Treasury Yield Curve Rates |
| Category | Interest Rates |
| Region | United States |
| Source | Department of the Treasury |
Stats
| Last Value | 0.92% |
| Latest Period | Jul 31 2026 |
| Last Updated | Jul 31 2026, 18:01 EDT |
| Long Term Average | 1.10% |
| Average Growth Rate | -619.7% |
| Value from The Previous Market Day | 0.86% |
| Change from The Previous Market Day | 6.98% |
| Value from 1 Year Ago | -0.04% |
| Change from 1 Year Ago | N/A |
| Frequency | Market Daily |
| Unit | Percent |
| Adjustment | N/A |
| Formula | 10 Year Treasury Rate - 3 Month Treasury Rate |
Historical Data
| Date | Value |
|---|---|
| July 31, 2026 | 0.92% |
| July 30, 2026 | 0.86% |
| July 29, 2026 | 0.84% |
| July 28, 2026 | 0.71% |
| July 27, 2026 | 0.69% |
| July 24, 2026 | 0.73% |
| July 23, 2026 | 0.76% |
| July 22, 2026 | 0.78% |
| July 21, 2026 | 0.76% |
| July 20, 2026 | 0.74% |
| July 17, 2026 | 0.70% |
| July 16, 2026 | 0.73% |
| July 15, 2026 | 0.72% |
| July 14, 2026 | 0.74% |
| July 13, 2026 | 0.73% |
| July 10, 2026 | 0.71% |
| July 09, 2026 | 0.71% |
| July 08, 2026 | 0.69% |
| July 07, 2026 | 0.69% |
| July 06, 2026 | 0.61% |
| July 02, 2026 | 0.67% |
| July 01, 2026 | 0.63% |
| June 30, 2026 | 0.57% |
| June 29, 2026 | 0.51% |
| June 26, 2026 | 0.55% |
| Date | Value |
|---|---|
| June 25, 2026 | 0.56% |
| June 24, 2026 | 0.56% |
| June 23, 2026 | 0.65% |
| June 22, 2026 | 0.66% |
| June 18, 2026 | 0.63% |
| June 17, 2026 | 0.66% |
| June 16, 2026 | 0.64% |
| June 15, 2026 | 0.68% |
| June 12, 2026 | 0.70% |
| June 11, 2026 | 0.67% |
| June 10, 2026 | 0.76% |
| June 09, 2026 | 0.74% |
| June 08, 2026 | 0.76% |
| June 05, 2026 | 0.77% |
| June 04, 2026 | 0.69% |
| June 03, 2026 | 0.71% |
| June 02, 2026 | 0.69% |
| June 01, 2026 | 0.69% |
| May 29, 2026 | 0.76% |
| May 28, 2026 | 0.76% |
| May 27, 2026 | 0.80% |
| May 26, 2026 | 0.82% |
| May 22, 2026 | 0.88% |
| May 21, 2026 | 0.89% |
| May 20, 2026 | 0.92% |
News
Basic Info
|
10 Year-3 Month Treasury Yield Spread is at 0.92%, compared to 0.86% the previous market day and -0.04% last year. This is lower than the long term average of 1.10%. |
|
The 10 Year-3 Month Treasury Yield Spread is the difference between the 10 year treasury rate and the 3 month treasury rate. This spread is widely used as a gauge to study the yield curve. A 10 year-3 month treasury spread that approaches 0 signifies a "flattening" yield curve. Furthermore, a negative 10 year-3 month spread has historically been viewed as a precursor or predictor of a recessionary period. The New York Fed uses the rate in a model to predict recessions 2 to 6 quarters ahead. Track the full US Treasury yield curve with our Yield Curve Tool. |
| Report | Daily Treasury Yield Curve Rates |
| Category | Interest Rates |
| Region | United States |
| Source | Department of the Treasury |
Stats
| Last Value | 0.92% |
| Latest Period | Jul 31 2026 |
| Last Updated | Jul 31 2026, 18:01 EDT |
| Long Term Average | 1.10% |
| Average Growth Rate | -619.7% |
| Value from The Previous Market Day | 0.86% |
| Change from The Previous Market Day | 6.98% |
| Value from 1 Year Ago | -0.04% |
| Change from 1 Year Ago | N/A |
| Frequency | Market Daily |
| Unit | Percent |
| Adjustment | N/A |
| Formula | 10 Year Treasury Rate - 3 Month Treasury Rate |
Related Indicators
| Treasury Yield Curve |
| 1 Month Treasury Rate | 3.78% |
| 1 Year Treasury Rate | 4.08% |
| 10 Year Treasury Rate | 4.75% |
| 10-2 Year Treasury Yield Spread | 0.47% |
| 20 Year Treasury Rate | 5.28% |
| 3 Month Treasury Rate | 3.83% |
| 3 Year Treasury Rate | 4.34% |
| 30 Year Treasury Rate | 5.27% |
| 30-10 Year Treasury Yield Spread | 0.52% |
| 5 Year Treasury Rate | 4.45% |
| 6 Month Treasury Rate | 3.98% |
| 7 Year Treasury Rate | 4.59% |