

30-10 Year Treasury Yield Spread (I:3010YTYS)
Level Chart
Basic Info
|
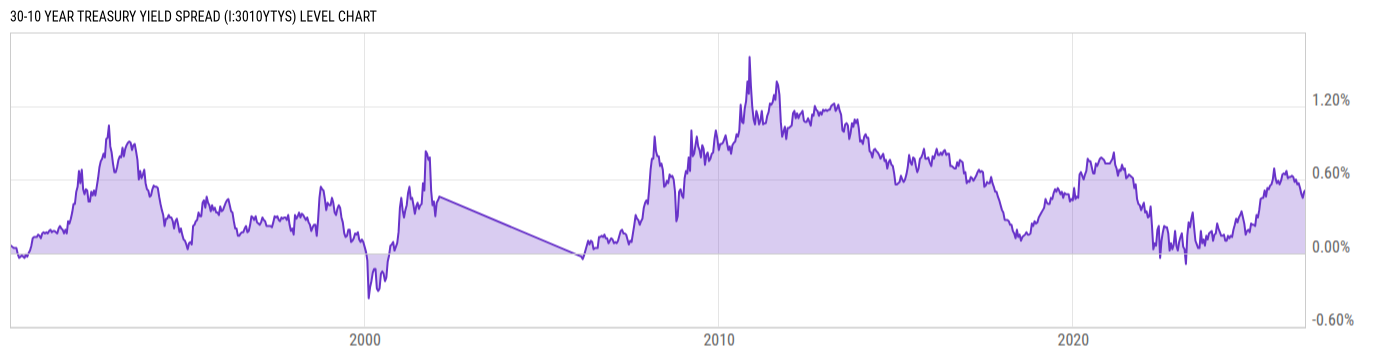
30-10 Year Treasury Yield Spread is at 0.51%, compared to 0.52% the previous market day and 0.54% last year. This is higher than the long term average of 0.49%. |
|
The 30-10 Treasury Yield Spread is the difference between the 30 year treasury rate and the 10 year treasury rate. A 30-10 treasury spread that approaches 0 signifies a "flattening" yield curve, if the spread goes negative, this indicates a flight to safety that can signal a lack of confidence in the strength of the economy. Track the full US Treasury yield curve with our Yield Curve Tool. |
| Report | Daily Treasury Yield Curve Rates |
| Category | Interest Rates |
| Region | United States |
| Source | Department of the Treasury |
Stats
| Last Value | 0.51% |
| Latest Period | Jul 17 2026 |
| Last Updated | Jul 17 2026, 18:04 EDT |
| Long Term Average | 0.49% |
| Average Growth Rate | 70.16% |
| Value from The Previous Market Day | 0.52% |
| Change from The Previous Market Day | -1.92% |
| Value from 1 Year Ago | 0.54% |
| Change from 1 Year Ago | -5.56% |
| Frequency | Market Daily |
| Unit | Percent |
| Adjustment | N/A |
| Formula | 30 Year Treasury Rate - 10 Year Treasury Rate |
Historical Data
| Date | Value |
|---|---|
| July 17, 2026 | 0.51% |
| July 16, 2026 | 0.52% |
| July 15, 2026 | 0.53% |
| July 14, 2026 | 0.50% |
| July 13, 2026 | 0.48% |
| July 10, 2026 | 0.50% |
| July 09, 2026 | 0.51% |
| July 08, 2026 | 0.50% |
| July 07, 2026 | 0.50% |
| July 06, 2026 | 0.51% |
| July 02, 2026 | 0.49% |
| July 01, 2026 | 0.49% |
| June 30, 2026 | 0.47% |
| June 29, 2026 | 0.48% |
| June 26, 2026 | 0.49% |
| June 25, 2026 | 0.46% |
| June 24, 2026 | 0.45% |
| June 23, 2026 | 0.44% |
| June 22, 2026 | 0.44% |
| June 18, 2026 | 0.44% |
| June 17, 2026 | 0.44% |
| June 16, 2026 | 0.50% |
| June 15, 2026 | 0.50% |
| June 12, 2026 | 0.49% |
| June 11, 2026 | 0.50% |
| Date | Value |
|---|---|
| June 10, 2026 | 0.48% |
| June 09, 2026 | 0.48% |
| June 08, 2026 | 0.47% |
| June 05, 2026 | 0.46% |
| June 04, 2026 | 0.50% |
| June 03, 2026 | 0.50% |
| June 02, 2026 | 0.51% |
| June 01, 2026 | 0.52% |
| May 29, 2026 | 0.54% |
| May 28, 2026 | 0.53% |
| May 27, 2026 | 0.53% |
| May 26, 2026 | 0.53% |
| May 22, 2026 | 0.51% |
| May 21, 2026 | 0.53% |
| May 20, 2026 | 0.54% |
| May 19, 2026 | 0.51% |
| May 18, 2026 | 0.53% |
| May 15, 2026 | 0.53% |
| May 14, 2026 | 0.55% |
| May 13, 2026 | 0.57% |
| May 12, 2026 | 0.57% |
| May 11, 2026 | 0.56% |
| May 08, 2026 | 0.57% |
| May 07, 2026 | 0.56% |
| May 06, 2026 | 0.58% |
News
Basic Info
|
30-10 Year Treasury Yield Spread is at 0.51%, compared to 0.52% the previous market day and 0.54% last year. This is higher than the long term average of 0.49%. |
|
The 30-10 Treasury Yield Spread is the difference between the 30 year treasury rate and the 10 year treasury rate. A 30-10 treasury spread that approaches 0 signifies a "flattening" yield curve, if the spread goes negative, this indicates a flight to safety that can signal a lack of confidence in the strength of the economy. Track the full US Treasury yield curve with our Yield Curve Tool. |
| Report | Daily Treasury Yield Curve Rates |
| Category | Interest Rates |
| Region | United States |
| Source | Department of the Treasury |
Stats
| Last Value | 0.51% |
| Latest Period | Jul 17 2026 |
| Last Updated | Jul 17 2026, 18:04 EDT |
| Long Term Average | 0.49% |
| Average Growth Rate | 70.16% |
| Value from The Previous Market Day | 0.52% |
| Change from The Previous Market Day | -1.92% |
| Value from 1 Year Ago | 0.54% |
| Change from 1 Year Ago | -5.56% |
| Frequency | Market Daily |
| Unit | Percent |
| Adjustment | N/A |
| Formula | 30 Year Treasury Rate - 10 Year Treasury Rate |
Related Indicators
| Treasury Yield Curve |
| 1 Month Treasury Rate | 3.73% |
| 1 Year Treasury Rate | 4.01% |
| 10 Year Treasury Rate | 4.55% |
| 10 Year-3 Month Treasury Yield Spread | 0.70% |
| 10-2 Year Treasury Yield Spread | 0.37% |
| 20 Year Treasury Rate | 5.07% |
| 3 Month Treasury Rate | 3.85% |
| 3 Year Treasury Rate | 4.21% |
| 30 Year Treasury Rate | 5.06% |
| 5 Year Treasury Rate | 4.28% |
| 6 Month Treasury Rate | 3.96% |
| 7 Year Treasury Rate | 4.40% |