

10 Year Treasury Rate (I:10YTCMR)
Level Chart
Basic Info
|
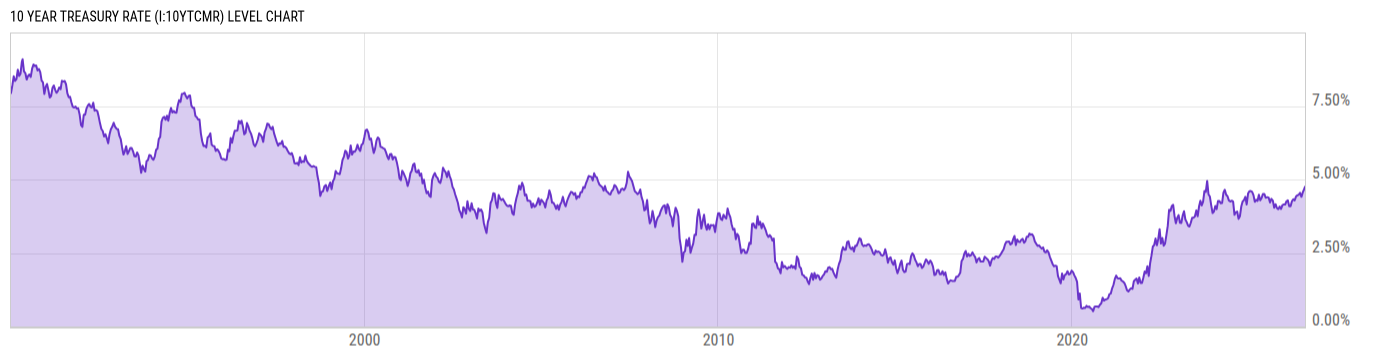
10 Year Treasury Rate is at 4.75%, compared to 4.68% the previous market day and 4.37% last year. This is higher than the long term average of 4.25%. |
|
The 10 Year Treasury Rate is the yield received for investing in a US government issued treasury security that has a maturity of 10 year. The 10 year treasury yield is included on the longer end of the yield curve. Many analysts will use the 10 year yield as the "risk free" rate when valuing the markets or an individual security. Historically, the 10 Year treasury rate reached 15.84% in 1981 as the Fed raised benchmark rates in an effort to contain inflation. Track the full US Treasury yield curve with our Yield Curve Tool. |
| Report | Daily Treasury Yield Curve Rates |
| Category | Interest Rates |
| Region | United States |
| Source | Department of the Treasury |
Stats
| Last Value | 4.75% |
| Latest Period | Jul 31 2026 |
| Last Updated | Jul 31 2026, 18:00 EDT |
| Next Release | Aug 3 2026, 18:00 EDT |
| Long Term Average | 4.25% |
| Average Growth Rate | 3.80% |
| Value from The Previous Market Day | 4.68% |
| Change from The Previous Market Day | 1.50% |
| Value from 1 Year Ago | 4.37% |
| Change from 1 Year Ago | 8.70% |
| Frequency | Market Daily |
| Unit | Percent |
| Adjustment | N/A |
| Download Source File |
Historical Data
| Date | Value |
|---|---|
| July 31, 2026 | 4.75% |
| July 30, 2026 | 4.68% |
| July 29, 2026 | 4.67% |
| July 28, 2026 | 4.61% |
| July 27, 2026 | 4.65% |
| July 24, 2026 | 4.69% |
| July 23, 2026 | 4.71% |
| July 22, 2026 | 4.67% |
| July 21, 2026 | 4.63% |
| July 20, 2026 | 4.60% |
| July 17, 2026 | 4.55% |
| July 16, 2026 | 4.57% |
| July 15, 2026 | 4.55% |
| July 14, 2026 | 4.58% |
| July 13, 2026 | 4.62% |
| July 10, 2026 | 4.56% |
| July 09, 2026 | 4.54% |
| July 08, 2026 | 4.56% |
| July 07, 2026 | 4.55% |
| July 06, 2026 | 4.48% |
| July 02, 2026 | 4.49% |
| July 01, 2026 | 4.48% |
| June 30, 2026 | 4.44% |
| June 29, 2026 | 4.38% |
| June 26, 2026 | 4.38% |
| Date | Value |
|---|---|
| June 25, 2026 | 4.40% |
| June 24, 2026 | 4.41% |
| June 23, 2026 | 4.50% |
| June 22, 2026 | 4.51% |
| June 18, 2026 | 4.46% |
| June 17, 2026 | 4.49% |
| June 16, 2026 | 4.43% |
| June 15, 2026 | 4.47% |
| June 12, 2026 | 4.48% |
| June 11, 2026 | 4.45% |
| June 10, 2026 | 4.55% |
| June 09, 2026 | 4.53% |
| June 08, 2026 | 4.56% |
| June 05, 2026 | 4.55% |
| June 04, 2026 | 4.47% |
| June 03, 2026 | 4.49% |
| June 02, 2026 | 4.46% |
| June 01, 2026 | 4.47% |
| May 29, 2026 | 4.45% |
| May 28, 2026 | 4.45% |
| May 27, 2026 | 4.48% |
| May 26, 2026 | 4.50% |
| May 22, 2026 | 4.56% |
| May 21, 2026 | 4.57% |
| May 20, 2026 | 4.57% |
News
Basic Info
|
10 Year Treasury Rate is at 4.75%, compared to 4.68% the previous market day and 4.37% last year. This is higher than the long term average of 4.25%. |
|
The 10 Year Treasury Rate is the yield received for investing in a US government issued treasury security that has a maturity of 10 year. The 10 year treasury yield is included on the longer end of the yield curve. Many analysts will use the 10 year yield as the "risk free" rate when valuing the markets or an individual security. Historically, the 10 Year treasury rate reached 15.84% in 1981 as the Fed raised benchmark rates in an effort to contain inflation. Track the full US Treasury yield curve with our Yield Curve Tool. |
| Report | Daily Treasury Yield Curve Rates |
| Category | Interest Rates |
| Region | United States |
| Source | Department of the Treasury |
Stats
| Last Value | 4.75% |
| Latest Period | Jul 31 2026 |
| Last Updated | Jul 31 2026, 18:00 EDT |
| Next Release | Aug 3 2026, 18:00 EDT |
| Long Term Average | 4.25% |
| Average Growth Rate | 3.80% |
| Value from The Previous Market Day | 4.68% |
| Change from The Previous Market Day | 1.50% |
| Value from 1 Year Ago | 4.37% |
| Change from 1 Year Ago | 8.70% |
| Frequency | Market Daily |
| Unit | Percent |
| Adjustment | N/A |
| Download Source File |
Related Indicators
| Treasury Yield Curve |
| 1 Month Treasury Rate | 3.78% |
| 1 Year Treasury Rate | 4.08% |
| 10 Year-3 Month Treasury Yield Spread | 0.92% |
| 10-2 Year Treasury Yield Spread | 0.47% |
| 20 Year Treasury Rate | 5.28% |
| 3 Month Treasury Rate | 3.83% |
| 3 Year Treasury Rate | 4.34% |
| 30 Year Treasury Rate | 5.27% |
| 30-10 Year Treasury Yield Spread | 0.52% |
| 5 Year Treasury Rate | 4.45% |
| 6 Month Treasury Rate | 3.98% |
| 7 Year Treasury Rate | 4.59% |