

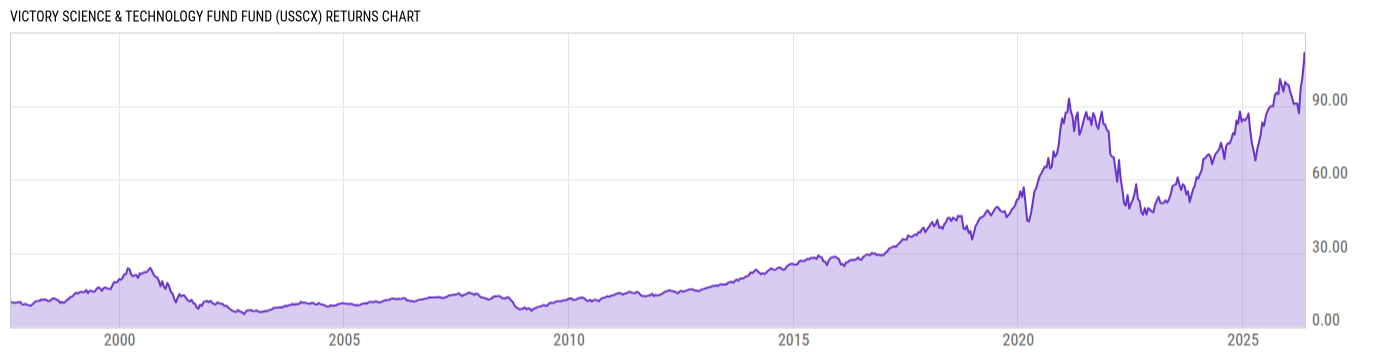
Victory Science & Technology Fund Fund (USSCX)
37.76
-0.42
(-1.10%)
USD |
Jun 09 2026
Returns Chart
Key Stats
| Net Expense Ratio | Total Assets Under Management | Weighted Average Dividend Yield | Turnover Ratio (Generic) |
|---|---|---|---|
| 0.96% | 1.515B | 0.25% | -- |
| 1 Year Fund Level Flows | 1 Year Total Returns (Daily) | Annualized Total Returns Since Inception (Daily) | Max Drawdown (Since Inception) |
| -136.97M | 34.50% |
Basic Info
| Investment Strategy | |
| The Fund seeks long-term capital appreciation. The Fund invests at least 80% of its assets in equity securities of companies expected to benefit from the development and use of scientific and technological advances and improvement. The Fund may invest up to 50% of its assets in foreign securities. |
| General | |
| Security Type | Mutual Fund |
| Equity Style | Multi Cap Growth |
| Broad Asset Class | Sector Equity |
| Broad Category | Equity |
| Global Peer Group | Equity Sector Information Technology |
| Peer Group | Science & Technology Funds |
| Global Macro | Equity Industry Sector |
| US Macro | Sector Equity Funds |
| YCharts Categorization | -- |
| YCharts Benchmark | -- |
| Prospectus Objective | Science & Technology Funds |
| Fund Owner Firm Name | Victory Funds |
| Broad Asset Class Benchmark Index | |
| ^MSWNTR | 100.0% |
Net Fund Flows Versus Peer Group
1 Month
% Rank:
80
-1.584B
Peer Group Low
8.118B
Peer Group High
1 Year
% Rank:
80
-136.97M
-4.469B
Peer Group Low
10.39B
Peer Group High
3 Months
% Rank:
77
-774.23M
Peer Group Low
10.39B
Peer Group High
3 Years
% Rank:
79
-4.860B
Peer Group Low
21.88B
Peer Group High
6 Months
% Rank:
74
-1.624B
Peer Group Low
10.39B
Peer Group High
5 Years
% Rank:
80
-6.781B
Peer Group Low
23.89B
Peer Group High
YTD
% Rank:
75
-1.260B
Peer Group Low
10.39B
Peer Group High
10 Years
% Rank:
87
-12.98B
Peer Group Low
34.68B
Peer Group High
Date Unavailable
Risk
Performance Versus Peer Group
Annual Total Returns Versus Peers
As of June 10, 2026.
Asset Allocation
As of March 31, 2026.
| Type | % Net |
|---|---|
| Cash | 0.49% |
| Stock | 99.58% |
| Bond | 0.00% |
| Convertible | 0.00% |
| Preferred | 0.00% |
| Other | -0.06% |
Top 10 Holdings
| Name | % Weight | Price | % Change |
|---|---|---|---|
| NVIDIA Corp. | 10.72% | 200.44 | -3.72% |
| Meta Platforms, Inc. | 5.90% | 570.96 | -2.33% |
| Microsoft Corp. | 5.79% | 397.35 | -1.50% |
| Alphabet, Inc. | 3.49% | 356.50 | -2.13% |
| Broadcom Inc. | 3.46% | 371.92 | -5.16% |
| Amazon.com, Inc. | 3.41% | 237.99 | -2.54% |
| Lam Research Corp. | 2.59% | 321.89 | -1.61% |
| Applovin Corp. | 2.44% | 492.91 | -5.36% |
| Coherent Corp. | 2.40% | 355.08 | -0.24% |
| MACOM Technology Solutions Holdings, Inc. | 2.39% | 354.28 | -1.24% |
Fees & Availability
| Fees | |
| Actual 12B-1 Fee | -- |
| Actual Management Fee | 0.70% |
| Administration Fee | 1.81M% |
| Maximum Front Load | -- |
| Maximum Deferred Load | -- |
| Maximum Redemption Fee | -- |
| General Availability | |
| Available for Insurance Product | No |
| Available for RRSP | No |
| Purchase Details | |
| Open to New Investors |
|
| Minimum Initial Investment | 3000.00 None |
| Minimum Subsequent Investment | 50.00 None |
Basic Info
| Investment Strategy | |
| The Fund seeks long-term capital appreciation. The Fund invests at least 80% of its assets in equity securities of companies expected to benefit from the development and use of scientific and technological advances and improvement. The Fund may invest up to 50% of its assets in foreign securities. |
| General | |
| Security Type | Mutual Fund |
| Equity Style | Multi Cap Growth |
| Broad Asset Class | Sector Equity |
| Broad Category | Equity |
| Global Peer Group | Equity Sector Information Technology |
| Peer Group | Science & Technology Funds |
| Global Macro | Equity Industry Sector |
| US Macro | Sector Equity Funds |
| YCharts Categorization | -- |
| YCharts Benchmark | -- |
| Prospectus Objective | Science & Technology Funds |
| Fund Owner Firm Name | Victory Funds |
| Broad Asset Class Benchmark Index | |
| ^MSWNTR | 100.0% |
Fundamentals
| General | |
| Distribution Yield | -- |
| Dividend Yield TTM (6-8-26) | 0.81% |
| 30-Day SEC Yield (5-31-26) | 0.00% |
| 7-Day SEC Yield | -- |
| Number of Holdings | 193 |
| Stock | |
| Weighted Average PE Ratio | 38.88 |
| Weighted Average Price to Sales Ratio | 12.93 |
| Weighted Average Price to Book Ratio | 13.56 |
| Weighted Median ROE | 38.81% |
| Weighted Median ROA | 15.74% |
| ROI (TTM) | 21.46% |
| Return on Investment (TTM) | 21.46% |
| Earning Yield | 0.0305 |
| LT Debt / Shareholders Equity | 0.7058 |
| Number of Equity Holdings | 189 |
As of March 31, 2026
Growth Metrics
| EPS Growth (1Y) | 31.15% |
| EPS Growth (3Y) | 40.13% |
| EPS Growth (5Y) | 39.18% |
| Sales Growth (1Y) | 31.35% |
| Sales Growth (3Y) | 29.01% |
| Sales Growth (5Y) | 26.77% |
| Sales per Share Growth (1Y) | 126.2% |
| Sales per Share Growth (3Y) | 29.19% |
| Operating Cash Flow - Growth Rate (3Y) | 51.45% |
As of March 31, 2026
Fund Details
| Key Dates | |
| Inception Date | 8/1/1997 |
| Last Annual Report Date | 4/30/2025 |
| Last Prospectus Date | 9/1/2025 |
| Share Classes | |
| USTCX | A |
| Attributes | |
| Index Fund | -- |
| Inverse Fund | No |
| Leveraged Fund | -- |
| Fund of Funds | No |
| Currency Hedged Fund | -- |
| Socially Responsible Fund | No |
Top Portfolio Holders
| Name | % Weight |
|---|---|
| Portfolio A | 5.00% |
| Portfolio B | 3.50% |
| Portfolio C | 2.25% |
Excel Add-In Codes
| Name: =YCI("M:USSCX", "name") |
| Broad Asset Class: =YCI("M:USSCX", "broad_asset_class") |
| Broad Category: =YCI("M:USSCX", "broad_category_group") |
| Prospectus Objective: =YCI("M:USSCX", "prospectus_objective") |
| To find the codes for any of our securities and financial metrics, see our Complete Excel Reference. |