

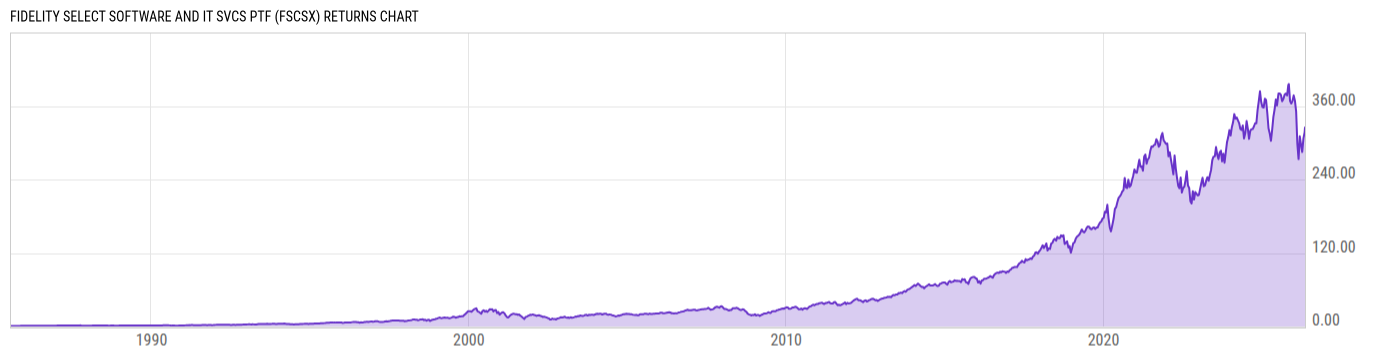
Fidelity Select Software and IT Svcs Ptf (FSCSX)
21.97
+1.22
(+5.88%)
USD |
May 29 2026
Returns Chart
Key Stats
| Net Expense Ratio | Total Assets Under Management | Weighted Average Dividend Yield | Turnover Ratio (Generic) |
|---|---|---|---|
| 0.61% | 6.457B | 0.42% | 14.00% |
| 1 Year Fund Level Flows | 1 Year Total Returns (Daily) | Annualized Total Returns Since Inception (Daily) | Max Drawdown (Since Inception) |
| -2.069B | 1.78% |
Basic Info
| Investment Strategy | |
| The Fund seeks capital appreciation. Fidelity Management & Research normally invests at least 80% of the assets in securities of companies engaged in research, design, production or distribution of products or processes that relate to software or information-based services. |
| General | |
| Security Type | Mutual Fund |
| Equity Style | Multi Cap Growth |
| Broad Asset Class | Sector Equity |
| Broad Category | Equity |
| Global Peer Group | Equity Sector Information Technology |
| Peer Group | Science & Technology Funds |
| Global Macro | Equity Industry Sector |
| US Macro | Sector Equity Funds |
| YCharts Categorization | -- |
| YCharts Benchmark | -- |
| Prospectus Objective | Science & Technology Funds |
| Fund Owner Firm Name | Fidelity Investments |
| Broad Asset Class Benchmark Index | |
| ^MSWNTR | 100.0% |
Net Fund Flows Versus Peer Group
1 Month
% Rank:
100
-1.584B
Peer Group Low
8.118B
Peer Group High
1 Year
% Rank:
100
-2.069B
-4.469B
Peer Group Low
10.39B
Peer Group High
3 Months
% Rank:
100
-1.257B
Peer Group Low
10.39B
Peer Group High
3 Years
% Rank:
100
-4.868B
Peer Group Low
21.80B
Peer Group High
6 Months
% Rank:
100
-2.035B
Peer Group Low
10.39B
Peer Group High
5 Years
% Rank:
100
-6.788B
Peer Group Low
23.72B
Peer Group High
YTD
% Rank:
100
-1.310B
Peer Group Low
10.39B
Peer Group High
10 Years
% Rank:
98
-12.98B
Peer Group Low
33.75B
Peer Group High
Date Unavailable
Risk
Performance Versus Peer Group
Annual Total Returns Versus Peers
As of May 30, 2026.
Asset Allocation
As of March 31, 2026.
| Type | % Net |
|---|---|
| Cash | 0.03% |
| Stock | 99.61% |
| Bond | 0.04% |
| Convertible | 0.00% |
| Preferred | 0.35% |
| Other | -0.03% |
Top 10 Holdings
| Name | % Weight | Price | % Change |
|---|---|---|---|
| Microsoft Corp. | 24.87% | 450.24 | 5.45% |
| Salesforce, Inc. | 4.69% | 191.10 | 8.47% |
| Palantir Technologies, Inc. | 4.61% | 156.54 | 9.21% |
| Intuit, Inc. | 3.96% | 331.53 | 5.92% |
| Oracle Corp. | 3.86% | 225.78 | 10.84% |
| Palo Alto Networks, Inc. | 3.66% | 281.69 | 9.28% |
| Datadog, Inc. | 3.26% | 247.35 | 9.82% |
| Twilio, Inc. | 3.23% | 190.64 | 3.27% |
| Synopsys, Inc. | 3.20% | 475.62 | -1.04% |
| Autodesk, Inc. | 2.99% | 231.31 | -4.00% |
Fees & Availability
| Fees | |
| Actual 12B-1 Fee | -- |
| Actual Management Fee | 0.60% |
| Administration Fee | -- |
| Maximum Front Load | 0.00% |
| Maximum Deferred Load | -- |
| Maximum Redemption Fee | 0.00% |
| General Availability | |
| Available for Insurance Product | No |
| Available for RRSP | No |
| Purchase Details | |
| Open to New Investors |
|
| Minimum Initial Investment | 0.00 None |
| Minimum Subsequent Investment | 0.00 None |
Basic Info
| Investment Strategy | |
| The Fund seeks capital appreciation. Fidelity Management & Research normally invests at least 80% of the assets in securities of companies engaged in research, design, production or distribution of products or processes that relate to software or information-based services. |
| General | |
| Security Type | Mutual Fund |
| Equity Style | Multi Cap Growth |
| Broad Asset Class | Sector Equity |
| Broad Category | Equity |
| Global Peer Group | Equity Sector Information Technology |
| Peer Group | Science & Technology Funds |
| Global Macro | Equity Industry Sector |
| US Macro | Sector Equity Funds |
| YCharts Categorization | -- |
| YCharts Benchmark | -- |
| Prospectus Objective | Science & Technology Funds |
| Fund Owner Firm Name | Fidelity Investments |
| Broad Asset Class Benchmark Index | |
| ^MSWNTR | 100.0% |
Fundamentals
| General | |
| Distribution Yield | -- |
| Dividend Yield TTM (5-28-26) | 0.84% |
| 30-Day SEC Yield (10-3-23) | 0.00% |
| 7-Day SEC Yield (10-3-23) | 0.00% |
| Number of Holdings | 57 |
| Stock | |
| Weighted Average PE Ratio | 37.10 |
| Weighted Average Price to Sales Ratio | 8.259 |
| Weighted Average Price to Book Ratio | 9.618 |
| Weighted Median ROE | 21.25% |
| Weighted Median ROA | 9.53% |
| ROI (TTM) | 11.66% |
| Return on Investment (TTM) | 11.66% |
| Earning Yield | 0.0329 |
| LT Debt / Shareholders Equity | 0.6750 |
| Number of Equity Holdings | 55 |
As of March 31, 2026
Growth Metrics
| EPS Growth (1Y) | 23.42% |
| EPS Growth (3Y) | 26.37% |
| EPS Growth (5Y) | 19.93% |
| Sales Growth (1Y) | 22.19% |
| Sales Growth (3Y) | 19.09% |
| Sales Growth (5Y) | 22.96% |
| Sales per Share Growth (1Y) | 21.97% |
| Sales per Share Growth (3Y) | 22.80% |
| Operating Cash Flow - Growth Rate (3Y) | 34.95% |
As of March 31, 2026
Fund Details
| Key Dates | |
| Inception Date | 7/29/1985 |
| Last Annual Report Date | 2/28/2025 |
| Last Prospectus Date | 4/29/2026 |
| Attributes | |
| Index Fund | -- |
| Inverse Fund | No |
| Leveraged Fund | -- |
| Fund of Funds | No |
| Currency Hedged Fund | -- |
| Socially Responsible Fund | No |
Top Portfolio Holders
| Name | % Weight |
|---|---|
| Portfolio A | 5.00% |
| Portfolio B | 3.50% |
| Portfolio C | 2.25% |
Excel Add-In Codes
| Name: =YCI("M:FSCSX", "name") |
| Broad Asset Class: =YCI("M:FSCSX", "broad_asset_class") |
| Broad Category: =YCI("M:FSCSX", "broad_category_group") |
| Prospectus Objective: =YCI("M:FSCSX", "prospectus_objective") |
| To find the codes for any of our securities and financial metrics, see our Complete Excel Reference. |