

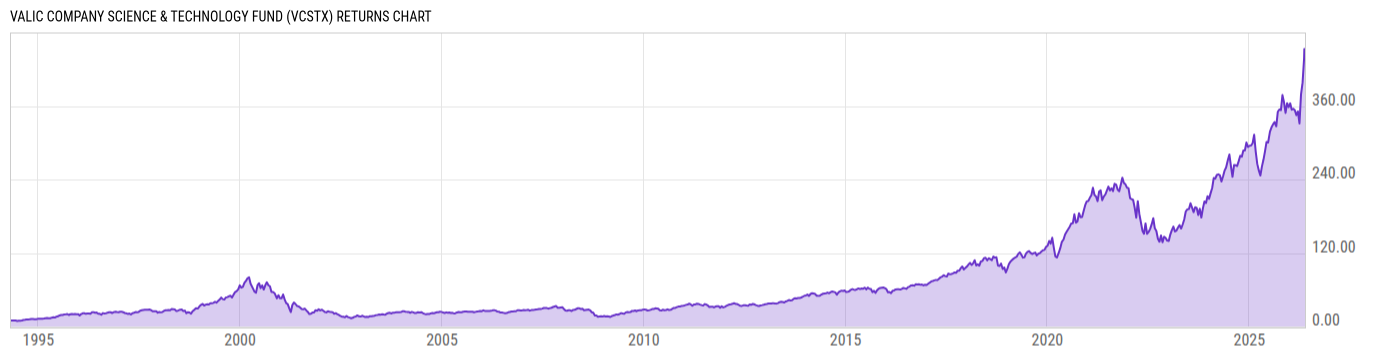
VALIC Company Science & Technology Fund (VCSTX)
47.09
-0.23
(-0.49%)
USD |
Jun 09 2026
Returns Chart
Key Stats
| Net Expense Ratio | Total Assets Under Management | Weighted Average Dividend Yield | Turnover Ratio (Generic) |
|---|---|---|---|
| 0.91% | 3.674B | 0.30% | 67.00% |
| 1 Year Fund Level Flows | 1 Year Total Returns (Daily) | Annualized Total Returns Since Inception (Daily) | Max Drawdown (Since Inception) |
| -449.41M | 47.84% |
Basic Info
| Investment Strategy | |
| The Fund seeks long-term capital appreciation primarily in the common stocks of companies that are expected to benefit from the development, advancement and use of science and technology. |
| General | |
| Security Type | Insurance Fund |
| Equity Style | Large Cap Growth |
| Broad Asset Class | Sector Equity |
| Broad Category | Equity |
| Global Peer Group | Equity Sector Information Technology |
| Peer Group | Science & Technology Funds |
| Global Macro | Equity Industry Sector |
| US Macro | Sector Equity Funds |
| YCharts Categorization | -- |
| YCharts Benchmark | -- |
| Prospectus Objective | Science & Technology Funds |
| Fund Owner Firm Name | AIG |
| Broad Asset Class Benchmark Index | |
| ^MSWNTR | 100.0% |
Net Fund Flows Versus Peer Group
1 Month
% Rank:
95
-1.584B
Peer Group Low
8.118B
Peer Group High
1 Year
% Rank:
92
-449.41M
-4.469B
Peer Group Low
10.39B
Peer Group High
3 Months
% Rank:
93
-774.23M
Peer Group Low
10.39B
Peer Group High
3 Years
% Rank:
90
-4.860B
Peer Group Low
21.88B
Peer Group High
6 Months
% Rank:
90
-1.624B
Peer Group Low
10.39B
Peer Group High
5 Years
% Rank:
89
-6.781B
Peer Group Low
23.89B
Peer Group High
YTD
% Rank:
91
-1.260B
Peer Group Low
10.39B
Peer Group High
10 Years
% Rank:
88
-12.98B
Peer Group Low
34.68B
Peer Group High
Date Unavailable
Risk
Performance Versus Peer Group
Annual Total Returns Versus Peers
As of June 11, 2026.
Asset Allocation
As of April 30, 2026.
| Type | % Net |
|---|---|
| Cash | 0.45% |
| Stock | 99.22% |
| Bond | 0.00% |
| Convertible | 0.00% |
| Preferred | 0.31% |
| Other | 0.03% |
Top 10 Holdings
| Name | % Weight | Price | % Change |
|---|---|---|---|
| NVIDIA Corp. | 12.04% | 200.44 | -3.72% |
| Broadcom Inc. | 7.67% | 371.92 | -5.16% |
| Apple, Inc. | 6.71% | 291.63 | 0.37% |
| Alphabet, Inc. | 5.52% | 353.43 | -2.45% |
| Microsoft Corp. | 5.23% | 397.35 | -1.50% |
| Samsung Electronics Co., Ltd. | 4.85% | 140.00 | 0.00% |
| Lam Research Corp. | 2.85% | 321.89 | -1.61% |
| Taiwan Semiconductor Manufacturing Co., Ltd. | 2.46% | 408.70 | -4.49% |
| Micron Technology, Inc. | 2.42% | 892.31 | -4.66% |
| Alphabet, Inc. | 2.37% | 356.50 | -2.13% |
Fees & Availability
| Fees | |
| Actual 12B-1 Fee | -- |
| Actual Management Fee | 0.81% |
| Administration Fee | 1.87M% |
| Maximum Front Load | -- |
| Maximum Deferred Load | -- |
| Maximum Redemption Fee | -- |
| General Availability | |
| Available for Insurance Product |
|
| Available for RRSP | No |
| Purchase Details | |
| Open to New Investors |
|
| Minimum Initial Investment | 0.00 None |
| Minimum Subsequent Investment | 0.00 None |
Basic Info
| Investment Strategy | |
| The Fund seeks long-term capital appreciation primarily in the common stocks of companies that are expected to benefit from the development, advancement and use of science and technology. |
| General | |
| Security Type | Insurance Fund |
| Equity Style | Large Cap Growth |
| Broad Asset Class | Sector Equity |
| Broad Category | Equity |
| Global Peer Group | Equity Sector Information Technology |
| Peer Group | Science & Technology Funds |
| Global Macro | Equity Industry Sector |
| US Macro | Sector Equity Funds |
| YCharts Categorization | -- |
| YCharts Benchmark | -- |
| Prospectus Objective | Science & Technology Funds |
| Fund Owner Firm Name | AIG |
| Broad Asset Class Benchmark Index | |
| ^MSWNTR | 100.0% |
Fundamentals
| General | |
| Distribution Yield | -- |
| Dividend Yield TTM (6-8-26) | 0.04% |
| 30-Day SEC Yield | -- |
| 7-Day SEC Yield | -- |
| Number of Holdings | 105 |
| Stock | |
| Weighted Average PE Ratio | 42.96 |
| Weighted Average Price to Sales Ratio | 16.56 |
| Weighted Average Price to Book Ratio | 16.86 |
| Weighted Median ROE | 57.23% |
| Weighted Median ROA | 24.48% |
| ROI (TTM) | 31.59% |
| Return on Investment (TTM) | 31.59% |
| Earning Yield | 0.0268 |
| LT Debt / Shareholders Equity | 0.4930 |
| Number of Equity Holdings | 94 |
As of April 30, 2026
Growth Metrics
| EPS Growth (1Y) | 42.93% |
| EPS Growth (3Y) | 28.31% |
| EPS Growth (5Y) | 35.72% |
| Sales Growth (1Y) | 27.96% |
| Sales Growth (3Y) | 23.91% |
| Sales Growth (5Y) | 23.33% |
| Sales per Share Growth (1Y) | 27.70% |
| Sales per Share Growth (3Y) | 23.33% |
| Operating Cash Flow - Growth Rate (3Y) | 37.61% |
As of April 30, 2026
Fund Details
| Key Dates | |
| Launch Date | 4/29/1994 |
| Last Annual Report Date | 5/31/2025 |
| Last Prospectus Date | 10/1/2025 |
| Attributes | |
| Index Fund | -- |
| Inverse Fund | No |
| Leveraged Fund | -- |
| Fund of Funds | No |
| Currency Hedged Fund | -- |
| Socially Responsible Fund | No |
Top Portfolio Holders
| Name | % Weight |
|---|---|
| Portfolio A | 5.00% |
| Portfolio B | 3.50% |
| Portfolio C | 2.25% |