

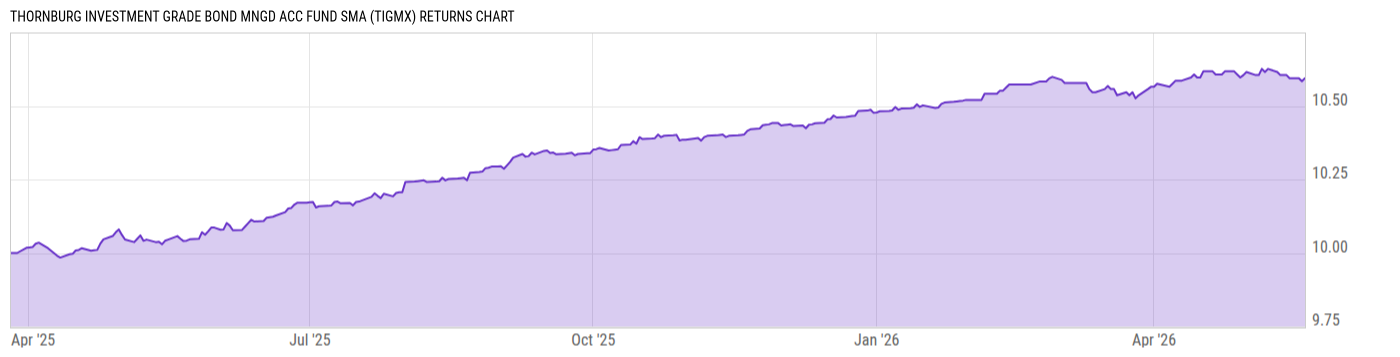
Thornburg Investment Grade Bond Mngd Acc Fund SMA (TIGMX)
10.02
+0.01
(+0.10%)
USD |
May 20 2026
Returns Chart
Key Stats
| Net Expense Ratio | Total Assets Under Management | Weighted Average Dividend Yield | Turnover Ratio (Generic) |
|---|---|---|---|
| 0.00% | 2.225M | -- | 9.00% |
| 1 Year Fund Level Flows | 1 Year Total Returns (Daily) | Annualized Total Returns Since Inception (Daily) | Max Drawdown (Since Inception) |
| 119786.0 | 5.43% |
Basic Info
| Investment Strategy | |
| The Fund seeks total return. Under normal conditions, it invests at least 80% of its net assets in investment grade debt obligations. It may use derivatives to hedge against the decline in the value of certain of the Funds investments, or non-hedging purposes to gain investment exposure to particular assets. |
| General | |
| Security Type | Mutual Fund |
| Equity Style | -- |
| Broad Asset Class | Taxable Bond |
| Broad Category | Fixed Income |
| Global Peer Group | Bond USD Corporates |
| Peer Group | Corporate Debt Funds BBB-Rated |
| Global Macro | Bond Corporates |
| US Macro | General Domestic Taxable Fixed Income Funds |
| YCharts Categorization | -- |
| YCharts Benchmark | -- |
| Prospectus Objective | Corporate Debt Funds BBB-Rated |
| Fund Owner Firm Name | Thornburg |
| Broad Asset Class Benchmark Index | |
| ^BBUSATR | 100.0% |
Net Fund Flows Versus Peer Group
1 Month
% Rank:
34
-1.147B
Peer Group Low
1.940B
Peer Group High
1 Year
% Rank:
52
119786.0
-4.685B
Peer Group Low
13.40B
Peer Group High
3 Months
% Rank:
48
-357.27M
Peer Group Low
3.527B
Peer Group High
3 Years
% Rank:
49
-8.057B
Peer Group Low
24.97B
Peer Group High
6 Months
% Rank:
47
-1.778B
Peer Group Low
9.539B
Peer Group High
5 Years
% Rank:
49
-9.856B
Peer Group Low
27.17B
Peer Group High
YTD
% Rank:
45
-451.42M
Peer Group Low
7.193B
Peer Group High
10 Years
% Rank:
72
-7.443B
Peer Group Low
63.14B
Peer Group High
Date Unavailable
Risk
Performance Versus Peer Group
Annual Total Returns Versus Peers
As of May 21, 2026.
Asset Allocation
As of February 28, 2026.
| Type | % Net |
|---|---|
| Cash | 0.00% |
| Stock | 0.00% |
| Bond | 91.30% |
| Convertible | 0.00% |
| Preferred | 0.00% |
| Other | 8.70% |
Top 10 Holdings
| Name | % Weight | Price | % Change |
|---|---|---|---|
|
THORNBURG CAPITAL MANAGEMENT FUND
|
11.76% | -- | -- |
|
CSMC TRUST 18RPL9 A1 SEQ FIX 3.85% 25-SEP-2057
|
1.30% | -- | -- |
|
FLAGSTAR MORTGAGE TRUST 172 A3 FIX 3.5% 25-OCT-2047
|
1.16% | -- | -- |
|
CCG RECEIVABLES TRUST 232 A2 SEQ FIX 6.28% 14-APR-2032
|
1.15% | -- | -- |
|
MFA TRUST 20NQM3 A2 FIX 1.324% 26-JAN-2065
|
1.14% | -- | -- |
|
GCAT TRUST 21CM1 A1 FIX 2.469% 27-APR-2065
|
1.02% | -- | -- |
|
OSCAR US FUNDING TRUST 212 A4 SEQ FIX 1.27% 11-SEP-2028
|
1.00% | -- | -- |
|
VEROS AUTO RECEIVABLES TRUST 231 C FIX 8.32% 15-NOV-2028
|
0.96% | -- | -- |
| UL SOLUTIONS INC. ULSOL 6.5 10/20/2028 FIX USD Corporate | 0.95% | 104.27 | -0.23% |
|
CARVANA AUTO RECEIVABLES TRUST 24P1 A3 FIX 5.05% 10-APR-2029
|
0.94% | -- | -- |
Fees & Availability
| Fees | |
| Actual 12B-1 Fee | -- |
| Actual Management Fee | -- |
| Administration Fee | -- |
| Maximum Front Load | -- |
| Maximum Deferred Load | -- |
| Maximum Redemption Fee | -- |
| General Availability | |
| Available for Insurance Product | No |
| Available for RRSP | No |
| Purchase Details | |
| Open to New Investors |
|
| Minimum Initial Investment | 0.00 None |
| Minimum Subsequent Investment | 0.00 None |
Basic Info
| Investment Strategy | |
| The Fund seeks total return. Under normal conditions, it invests at least 80% of its net assets in investment grade debt obligations. It may use derivatives to hedge against the decline in the value of certain of the Funds investments, or non-hedging purposes to gain investment exposure to particular assets. |
| General | |
| Security Type | Mutual Fund |
| Equity Style | -- |
| Broad Asset Class | Taxable Bond |
| Broad Category | Fixed Income |
| Global Peer Group | Bond USD Corporates |
| Peer Group | Corporate Debt Funds BBB-Rated |
| Global Macro | Bond Corporates |
| US Macro | General Domestic Taxable Fixed Income Funds |
| YCharts Categorization | -- |
| YCharts Benchmark | -- |
| Prospectus Objective | Corporate Debt Funds BBB-Rated |
| Fund Owner Firm Name | Thornburg |
| Broad Asset Class Benchmark Index | |
| ^BBUSATR | 100.0% |
Fundamentals
| General | |
| Distribution Yield | -- |
| Dividend Yield TTM (5-20-26) | 5.10% |
| 30-Day SEC Yield | -- |
| 7-Day SEC Yield | -- |
| Number of Holdings | 171 |
| Bond | |
| Yield to Maturity (2-28-26) | 4.08% |
| Effective Duration | -- |
| Average Coupon | 4.24% |
| Calculated Average Quality | 2.233 |
| Effective Maturity | 12.10 |
| Nominal Maturity | 12.19 |
| Number of Bond Holdings | 164 |
As of February 28, 2026
Fund Details
| Key Dates | |
| Inception Date | 3/26/2025 |
| Last Annual Report Date | 9/30/2025 |
| Last Prospectus Date | 2/1/2026 |
| Attributes | |
| Index Fund | -- |
| Inverse Fund | No |
| Leveraged Fund | -- |
| Fund of Funds | No |
| Currency Hedged Fund | -- |
| Socially Responsible Fund | No |
Top Portfolio Holders
| Name | % Weight |
|---|---|
| Portfolio A | 5.00% |
| Portfolio B | 3.50% |
| Portfolio C | 2.25% |
Excel Add-In Codes
| Name: =YCI("M:TIGMX", "name") |
| Broad Asset Class: =YCI("M:TIGMX", "broad_asset_class") |
| Broad Category: =YCI("M:TIGMX", "broad_category_group") |
| Prospectus Objective: =YCI("M:TIGMX", "prospectus_objective") |
| To find the codes for any of our securities and financial metrics, see our Complete Excel Reference. |