

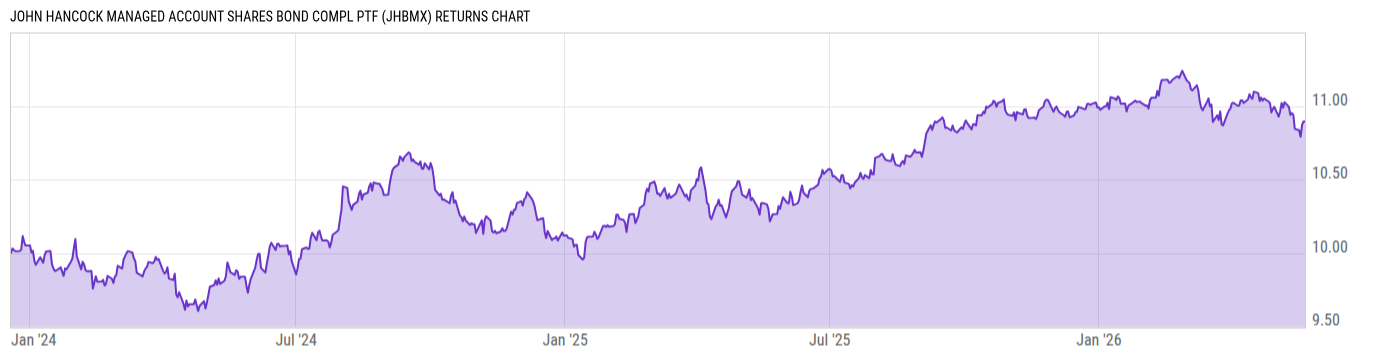
John Hancock Managed Account Shares Bond Compl Ptf (JHBMX)
9.66
+0.07
(+0.73%)
USD |
May 20 2026
Returns Chart
Key Stats
| Net Expense Ratio | Total Assets Under Management | Weighted Average Dividend Yield | Turnover Ratio (Generic) |
|---|---|---|---|
| 0.00% | 1.071M | -- | 52.00% |
| 1 Year Fund Level Flows | 1 Year Total Returns (Daily) | Annualized Total Returns Since Inception (Daily) | Max Drawdown (Since Inception) |
| -22332.00 | 5.54% |
Basic Info
| Investment Strategy | |
| The Fund seeks a high level of current income consistent with prudent investment risk. It will invest at least 80% of its net assets in investment-grade bonds and has no limit on average maturity. The manager focuses on sector allocation, industry allocation, and security selection in making investment decisions. |
| General | |
| Security Type | Mutual Fund |
| Equity Style | -- |
| Broad Asset Class | Taxable Bond |
| Broad Category | Fixed Income |
| Global Peer Group | Bond USD Corporates |
| Peer Group | Corporate Debt Funds BBB-Rated |
| Global Macro | Bond Corporates |
| US Macro | General Domestic Taxable Fixed Income Funds |
| YCharts Categorization | -- |
| YCharts Benchmark | -- |
| Prospectus Objective | Corporate Debt Funds BBB-Rated |
| Fund Owner Firm Name | John Hancock Group |
| Broad Asset Class Benchmark Index | |
| ^BBUSATR | 100.0% |
Net Fund Flows Versus Peer Group
1 Month
% Rank:
37
-1.147B
Peer Group Low
1.940B
Peer Group High
1 Year
% Rank:
52
-22332.00
-4.685B
Peer Group Low
13.40B
Peer Group High
3 Months
% Rank:
47
-357.27M
Peer Group Low
3.527B
Peer Group High
3 Years
% Rank:
53
-8.057B
Peer Group Low
24.97B
Peer Group High
6 Months
% Rank:
47
-1.778B
Peer Group Low
9.539B
Peer Group High
5 Years
% Rank:
51
-9.856B
Peer Group Low
27.17B
Peer Group High
YTD
% Rank:
45
-451.42M
Peer Group Low
7.193B
Peer Group High
10 Years
% Rank:
74
-7.443B
Peer Group Low
63.14B
Peer Group High
Date Unavailable
Risk
Performance Versus Peer Group
Annual Total Returns Versus Peers
As of May 21, 2026.
Asset Allocation
As of February 28, 2026.
| Type | % Net |
|---|---|
| Cash | 0.00% |
| Stock | 0.00% |
| Bond | 98.50% |
| Convertible | 0.00% |
| Preferred | 0.00% |
| Other | 1.50% |
Top 10 Holdings
| Name | % Weight | Price | % Change |
|---|---|---|---|
|
Federal National Mortgage Association 01-FEB-2053 FS4137
|
27.57% | -- | -- |
|
Federal National Mortgage Association 01-NOV-2050 FM5299
|
19.33% | -- | -- |
| United States of America USGB 2.875 05/15/2049 FIX USD Government | 8.07% | 69.03 | 1.10% |
| United States of America USGB 4.75 05/15/2055 FIX USD Government | 6.20% | 94.31 | 1.03% |
| United States of America USGB 4.25 06/30/2031 FIX USD Government | 5.89% | 100.00 | 0.42% |
| United States of America USGB 4.25 11/15/2034 FIX USD Government | 3.97% | 98.25 | 0.65% |
| United States of America USGB 2.375 02/15/2042 FIX USD Government | 2.89% | 71.22 | 1.02% |
|
Federal National Mortgage Association 01-JUN-2052 CB3841
|
2.67% | -- | -- |
| Amgen Inc. AMGN 5.25 03/02/2033 FIX USD Corporate | 2.46% | 101.57 | 0.63% |
| Bank of America Corporation BACORP 5.015 07/22/2033 FLT USD Corporate '32 | 2.32% | 99.96 | 0.53% |
Fees & Availability
| Fees | |
| Actual 12B-1 Fee | -- |
| Actual Management Fee | -- |
| Administration Fee | -- |
| Maximum Front Load | -- |
| Maximum Deferred Load | -- |
| Maximum Redemption Fee | -- |
| General Availability | |
| Available for Insurance Product | No |
| Available for RRSP | No |
| Purchase Details | |
| Open to New Investors |
|
| Minimum Initial Investment | 0.00 None |
| Minimum Subsequent Investment | 0.00 None |
Basic Info
| Investment Strategy | |
| The Fund seeks a high level of current income consistent with prudent investment risk. It will invest at least 80% of its net assets in investment-grade bonds and has no limit on average maturity. The manager focuses on sector allocation, industry allocation, and security selection in making investment decisions. |
| General | |
| Security Type | Mutual Fund |
| Equity Style | -- |
| Broad Asset Class | Taxable Bond |
| Broad Category | Fixed Income |
| Global Peer Group | Bond USD Corporates |
| Peer Group | Corporate Debt Funds BBB-Rated |
| Global Macro | Bond Corporates |
| US Macro | General Domestic Taxable Fixed Income Funds |
| YCharts Categorization | -- |
| YCharts Benchmark | -- |
| Prospectus Objective | Corporate Debt Funds BBB-Rated |
| Fund Owner Firm Name | John Hancock Group |
| Broad Asset Class Benchmark Index | |
| ^BBUSATR | 100.0% |
Fundamentals
| General | |
| Distribution Yield | -- |
| Dividend Yield TTM (5-20-26) | 5.00% |
| 30-Day SEC Yield (4-30-26) | 4.77% |
| 7-Day SEC Yield | -- |
| Number of Holdings | 27 |
| Bond | |
| Yield to Maturity (2-28-26) | 4.35% |
| Effective Duration | -- |
| Average Coupon | 3.83% |
| Calculated Average Quality | 2.489 |
| Effective Maturity | 20.03 |
| Nominal Maturity | 20.04 |
| Number of Bond Holdings | 24 |
As of February 28, 2026
Fund Details
| Key Dates | |
| Inception Date | 12/19/2023 |
| Last Annual Report Date | 5/31/2025 |
| Last Prospectus Date | 10/1/2025 |
| Attributes | |
| Index Fund | -- |
| Inverse Fund | No |
| Leveraged Fund | -- |
| Fund of Funds | No |
| Currency Hedged Fund | -- |
| Socially Responsible Fund | No |
Top Portfolio Holders
| Name | % Weight |
|---|---|
| Portfolio A | 5.00% |
| Portfolio B | 3.50% |
| Portfolio C | 2.25% |
Excel Add-In Codes
| Name: =YCI("M:JHBMX", "name") |
| Broad Asset Class: =YCI("M:JHBMX", "broad_asset_class") |
| Broad Category: =YCI("M:JHBMX", "broad_category_group") |
| Prospectus Objective: =YCI("M:JHBMX", "prospectus_objective") |
| To find the codes for any of our securities and financial metrics, see our Complete Excel Reference. |