

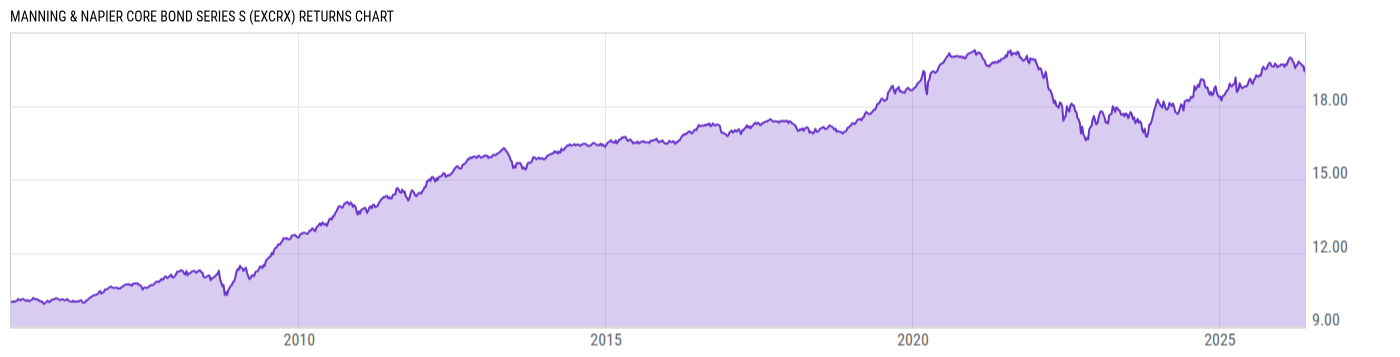
Manning & Napier Core Bond Series S (EXCRX)
9.16
+0.03
(+0.33%)
USD |
Jun 09 2026
Returns Chart
Key Stats
| Net Expense Ratio | Total Assets Under Management | Weighted Average Dividend Yield | Turnover Ratio (Generic) |
|---|---|---|---|
| 0.66% | 656.34M | -- | 38.00% |
| 1 Year Fund Level Flows | 1 Year Total Returns (Daily) | Annualized Total Returns Since Inception (Daily) | Max Drawdown (Since Inception) |
| -85.48M | 4.61% |
Basic Info
| Investment Strategy | |
| The Fund seeks to provide long-term total return by investing primarily in fixed income securities. The Fund will invest at least 80% of its assets in investment grade bonds and other financial instruments, principally derivative instruments and ETF's, with economic characteristics similar to bonds. |
| General | |
| Security Type | Mutual Fund |
| Equity Style | -- |
| Broad Asset Class | Taxable Bond |
| Broad Category | Fixed Income |
| Global Peer Group | Bond USD Medium Term |
| Peer Group | Core Plus Bond Funds |
| Global Macro | Bond HC |
| US Macro | Short/Intermediate Investment-Grade Funds |
| YCharts Categorization | -- |
| YCharts Benchmark | -- |
| Prospectus Objective | Core Bond Funds |
| Fund Owner Firm Name | Manning & Napier |
| Broad Asset Class Benchmark Index | |
| ^BBUSATR | 100.0% |
Net Fund Flows Versus Peer Group
1 Month
% Rank:
70
-355.03M
Peer Group Low
955.84M
Peer Group High
1 Year
% Rank:
75
-85.48M
-5.342B
Peer Group Low
5.732B
Peer Group High
3 Months
% Rank:
72
-1.705B
Peer Group Low
2.082B
Peer Group High
3 Years
% Rank:
39
-38.35B
Peer Group Low
16.67B
Peer Group High
6 Months
% Rank:
71
-3.114B
Peer Group Low
3.559B
Peer Group High
5 Years
% Rank:
38
-53.42B
Peer Group Low
16.59B
Peer Group High
YTD
% Rank:
72
-2.227B
Peer Group Low
3.045B
Peer Group High
10 Years
% Rank:
50
-55.60B
Peer Group Low
35.16B
Peer Group High
Date Unavailable
Risk
Performance Versus Peer Group
Annual Total Returns Versus Peers
As of June 10, 2026.
Asset Allocation
As of April 30, 2026.
| Type | % Net |
|---|---|
| Cash | 0.23% |
| Stock | 0.00% |
| Bond | 97.65% |
| Convertible | 0.00% |
| Preferred | 0.00% |
| Other | 2.12% |
Top 10 Holdings
| Name | % Weight | Price | % Change |
|---|---|---|---|
| United States of America USGB 3.625 02/15/2053 FIX USD Government | 6.20% | 79.06 | 0.63% |
| United States of America USGB 3.0 05/15/2047 FIX USD Government | 6.03% | 73.37 | 0.57% |
| United States of America USGB 2.375 02/15/2042 FIX USD Government | 5.93% | 72.11 | 0.47% |
| United States of America USGB 4.25 11/15/2034 FIX USD Government | 3.18% | 98.47 | 0.26% |
| United States of America USGB 4.0 11/15/2035 FIX USD Government | 3.07% | 96.07 | 0.30% |
| United States of America USGB 4.5 11/15/2033 FIX USD Government | 3.02% | 100.53 | 0.23% |
| United States of America USGB 1.375 11/15/2031 FIX USD Government | 2.93% | 85.95 | 0.20% |
| United States of America USGB 0.875 11/15/2030 FIX USD Government | 2.90% | 86.52 | 0.17% |
| United States of America USGB 4.125 11/15/2032 FIX USD Government | 2.01% | 98.70 | 0.20% |
|
Federal National Mortgage Association 01-APR-2054 FS7999
|
1.69% | -- | -- |
Fees & Availability
| Fees | |
| Actual 12B-1 Fee | 0.25% |
| Actual Management Fee | 0.25% |
| Administration Fee | -- |
| Maximum Front Load | -- |
| Maximum Deferred Load | -- |
| Maximum Redemption Fee | -- |
| General Availability | |
| Available for Insurance Product | No |
| Available for RRSP | No |
| Purchase Details | |
| Open to New Investors |
|
| Minimum Initial Investment | 2000.00 None |
| Minimum Subsequent Investment | 0.00 None |
Basic Info
| Investment Strategy | |
| The Fund seeks to provide long-term total return by investing primarily in fixed income securities. The Fund will invest at least 80% of its assets in investment grade bonds and other financial instruments, principally derivative instruments and ETF's, with economic characteristics similar to bonds. |
| General | |
| Security Type | Mutual Fund |
| Equity Style | -- |
| Broad Asset Class | Taxable Bond |
| Broad Category | Fixed Income |
| Global Peer Group | Bond USD Medium Term |
| Peer Group | Core Plus Bond Funds |
| Global Macro | Bond HC |
| US Macro | Short/Intermediate Investment-Grade Funds |
| YCharts Categorization | -- |
| YCharts Benchmark | -- |
| Prospectus Objective | Core Bond Funds |
| Fund Owner Firm Name | Manning & Napier |
| Broad Asset Class Benchmark Index | |
| ^BBUSATR | 100.0% |
Fundamentals
| General | |
| Distribution Yield | -- |
| Dividend Yield TTM (6-8-26) | 4.24% |
| 30-Day SEC Yield (5-31-26) | 4.45% |
| 7-Day SEC Yield | -- |
| Number of Holdings | 191 |
| Bond | |
| Yield to Maturity (4-30-26) | 4.85% |
| Effective Duration | 6.65 |
| Average Coupon | 4.13% |
| Calculated Average Quality | 2.359 |
| Effective Maturity | 16.93 |
| Nominal Maturity | 16.95 |
| Number of Bond Holdings | 180 |
As of April 30, 2026
Fund Details
Top Portfolio Holders
| Name | % Weight |
|---|---|
| Portfolio A | 5.00% |
| Portfolio B | 3.50% |
| Portfolio C | 2.25% |
Excel Add-In Codes
| Name: =YCI("M:EXCRX", "name") |
| Broad Asset Class: =YCI("M:EXCRX", "broad_asset_class") |
| Broad Category: =YCI("M:EXCRX", "broad_category_group") |
| Prospectus Objective: =YCI("M:EXCRX", "prospectus_objective") |
| To find the codes for any of our securities and financial metrics, see our Complete Excel Reference. |