

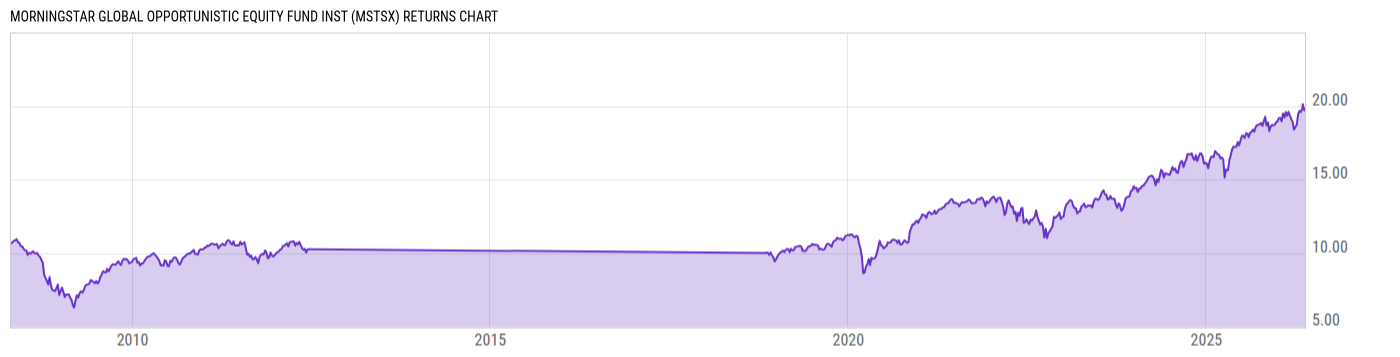
Morningstar Global Opportunistic Equity Fund Inst (MSTSX)
11.61
+0.04
(+0.35%)
USD |
Jun 09 2026
Returns Chart
Key Stats
| Net Expense Ratio | Total Assets Under Management | Weighted Average Dividend Yield | Turnover Ratio (Generic) |
|---|---|---|---|
| 0.81% | 426.38M | 2.86% | 58.00% |
| 1 Year Fund Level Flows | 1 Year Total Returns (Daily) | Annualized Total Returns Since Inception (Daily) | Max Drawdown (Since Inception) |
| 53.63M | 14.49% |
Basic Info
| Investment Strategy | |
| The Fund seeks long-term capital appreciation over a full market cycle. The Fund normally invest at least 80% of its assets in equity securities. The Fund invests in investment companies such as mutual funds and ETFs. The Fund invests in equity securities, which may include common stocks and real estate investment trusts. |
| General | |
| Security Type | Mutual Fund |
| Equity Style | Multi Cap Value |
| Broad Asset Class | International Equity |
| Broad Category | Equity |
| Global Peer Group | Equity Global |
| Peer Group | Global Multi-Cap Value |
| Global Macro | Equity Global |
| US Macro | Developed Global Markets Funds |
| YCharts Categorization | -- |
| YCharts Benchmark | -- |
| Prospectus Objective | Global Funds |
| Fund Owner Firm Name | Morningstar Investment Management |
| Broad Asset Class Benchmark Index | |
| ^MSACXUSNTR | 100.0% |
Net Fund Flows Versus Peer Group
1 Month
% Rank:
9
-62.35M
Peer Group Low
14.19M
Peer Group High
1 Year
% Rank:
16
53.63M
-667.25M
Peer Group Low
958.32M
Peer Group High
3 Months
% Rank:
10
-192.70M
Peer Group Low
151.28M
Peer Group High
3 Years
% Rank:
15
-2.611B
Peer Group Low
821.06M
Peer Group High
6 Months
% Rank:
10
-314.12M
Peer Group Low
642.17M
Peer Group High
5 Years
% Rank:
16
-3.448B
Peer Group Low
1.268B
Peer Group High
YTD
% Rank:
10
-294.51M
Peer Group Low
491.13M
Peer Group High
10 Years
% Rank:
9
-11.26B
Peer Group Low
1.543B
Peer Group High
Date Unavailable
Risk
Performance Versus Peer Group
Annual Total Returns Versus Peers
As of June 10, 2026.
Asset Allocation
As of April 30, 2026.
| Type | % Net |
|---|---|
| Cash | 1.01% |
| Stock | 95.80% |
| Bond | 0.93% |
| Convertible | 0.00% |
| Preferred | 1.72% |
| Other | 0.54% |
Top 10 Holdings
| Name | % Weight | Price | % Change |
|---|---|---|---|
| Vanguard Total Stock Market Index Fund ETF | 13.27% | 358.00 | -1.56% |
| Schwab Fundamental EM Equity ETF | 7.08% | 39.80 | -0.88% |
| Fidelity MSCI Information Technology Index ETF | 6.98% | 268.90 | -2.09% |
| Vanguard Communication Services Index Fund ETF | 4.47% | 185.92 | -0.85% |
| iShares Global Consumer Staples ETF | 4.30% | 69.04 | 1.54% |
| Vanguard Health Care Index Fund ETF | 3.94% | 284.10 | -1.14% |
| Schwab US REIT ETF | 3.24% | 23.94 | 0.13% |
| Franklin FTSE Japan ETF | 3.01% | 38.26 | -1.71% |
| KraneShares CSI China Internet ETF | 2.42% | 26.44 | 0.90% |
| Franklin FTSE Brazil ETF | 2.04% | 21.31 | -0.23% |
Fees & Availability
| Fees | |
| Actual 12B-1 Fee | -- |
| Actual Management Fee | 0.47% |
| Administration Fee | 190.7K% |
| Maximum Front Load | -- |
| Maximum Deferred Load | -- |
| Maximum Redemption Fee | -- |
| General Availability | |
| Available for Insurance Product | No |
| Available for RRSP | No |
| Purchase Details | |
| Open to New Investors |
|
| Minimum Initial Investment | 0.00 None |
| Minimum Subsequent Investment | 0.00 None |
Basic Info
| Investment Strategy | |
| The Fund seeks long-term capital appreciation over a full market cycle. The Fund normally invest at least 80% of its assets in equity securities. The Fund invests in investment companies such as mutual funds and ETFs. The Fund invests in equity securities, which may include common stocks and real estate investment trusts. |
| General | |
| Security Type | Mutual Fund |
| Equity Style | Multi Cap Value |
| Broad Asset Class | International Equity |
| Broad Category | Equity |
| Global Peer Group | Equity Global |
| Peer Group | Global Multi-Cap Value |
| Global Macro | Equity Global |
| US Macro | Developed Global Markets Funds |
| YCharts Categorization | -- |
| YCharts Benchmark | -- |
| Prospectus Objective | Global Funds |
| Fund Owner Firm Name | Morningstar Investment Management |
| Broad Asset Class Benchmark Index | |
| ^MSACXUSNTR | 100.0% |
Fundamentals
| General | |
| Distribution Yield | -- |
| Dividend Yield TTM (6-8-26) | 2.31% |
| 30-Day SEC Yield | -- |
| 7-Day SEC Yield | -- |
| Number of Holdings | 275 |
| Stock | |
| Weighted Average PE Ratio | 27.33 |
| Weighted Average Price to Sales Ratio | 5.716 |
| Weighted Average Price to Book Ratio | 6.878 |
| Weighted Median ROE | 70.07% |
| Weighted Median ROA | 10.16% |
| ROI (TTM) | 15.17% |
| Return on Investment (TTM) | 15.17% |
| Earning Yield | 0.0556 |
| LT Debt / Shareholders Equity | 1.178 |
| Number of Equity Holdings | 255 |
As of April 30, 2026
Growth Metrics
| EPS Growth (1Y) | 15.77% |
| EPS Growth (3Y) | 12.87% |
| EPS Growth (5Y) | 18.00% |
| Sales Growth (1Y) | 10.16% |
| Sales Growth (3Y) | 9.61% |
| Sales Growth (5Y) | 12.33% |
| Sales per Share Growth (1Y) | 42.21% |
| Sales per Share Growth (3Y) | 10.51% |
| Operating Cash Flow - Growth Rate (3Y) | 16.53% |
As of April 30, 2026
Fund Details
| Key Dates | |
| Inception Date | 11/2/2018 |
| Last Annual Report Date | 4/30/2025 |
| Last Prospectus Date | 8/31/2025 |
| Attributes | |
| Index Fund | -- |
| Inverse Fund | No |
| Leveraged Fund | -- |
| Fund of Funds | No |
| Currency Hedged Fund | -- |
| Socially Responsible Fund | No |
Top Portfolio Holders
| Name | % Weight |
|---|---|
| Portfolio A | 5.00% |
| Portfolio B | 3.50% |
| Portfolio C | 2.25% |
Excel Add-In Codes
| Name: =YCI("M:MSTSX", "name") |
| Broad Asset Class: =YCI("M:MSTSX", "broad_asset_class") |
| Broad Category: =YCI("M:MSTSX", "broad_category_group") |
| Prospectus Objective: =YCI("M:MSTSX", "prospectus_objective") |
| To find the codes for any of our securities and financial metrics, see our Complete Excel Reference. |