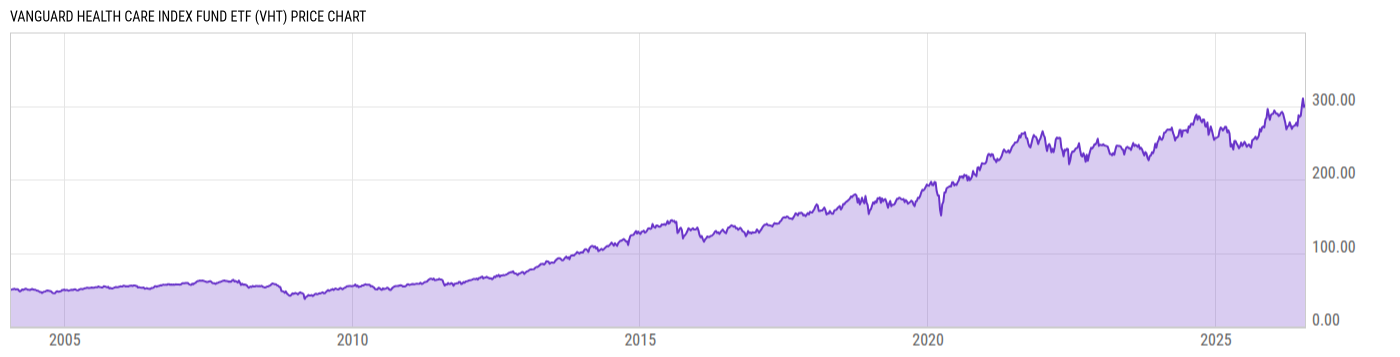
Vanguard Health Care ETF (VHT)
239.97
-0.94 (-0.39%)
USD |
Apr 22, 20:00
Price Chart
Key Stats
Customize
Expense Ratio | Discount or Premium to NAV | Total Assets Under Management | 30-Day Average Daily Volume |
---|---|---|---|
0.10% | -0.05% | 14.64B | 231602.2 |
Dividend Yield | Turnover Ratio | 1 Year Fund Level Flows | Max Drawdown (All) |
1.21% | 7.00% | 2.190B | Upgrade |
Basic Info
Investment Strategy | |
The investment seeks to track the performance of a benchmark index. The fund employs an indexing investment approach designed to track the performance of the MSCI US Investable Market Index (IMI)/Health Care 25/50, an index made up of stocks of large, mid-size, and small U.S. companies within the health care sector, as classified under the Global Industry Classification Standard (GICS). The Advisor attempts to replicate the target index by seeking to invest all, or substantially all, of its assets in the stocks that make up the index, in order to hold each stock in approximately the same proportion as its weighting in the index. The fund is non-diversified. |
General | |
Security Type | Exchange-Traded Fund |
Equity Style | Large Cap/Blend |
Fixed Income Style | -- |
Broad Asset Class | Sector Equity |
Broad Category | Equity |
Category Name | Health |
Category Index | S&P 1500 Health Care TR |
Prospectus Objective | Specialty - Health |
Fund Owner Firm Name | Vanguard |
Prospectus Benchmark Index | |
MSCI US IMI/Health Care 25-50 GR USD | 100.0% |
Broad Asset Class Benchmark Index | |
^MSWNTR | 100.0% |
Manager Tenure | |
Walter Nejman | 5.28 yrs |
Michelle Louie | 3.34 yrs |
Net Fund Flows Versus Category
1 Month
% Rank:
--
--
Category Low
--
Category High
1 Year
% Rank:
2
2.190B
-4.178B
Category Low
8.066B
Category High
3 Months
% Rank:
--
--
Category Low
--
Category High
3 Years
% Rank:
--
--
Category Low
--
Category High
6 Months
% Rank:
--
--
Category Low
--
Category High
5 Years
% Rank:
--
--
Category Low
--
Category High
YTD
% Rank:
--
--
Category Low
--
Category High
10 Years
% Rank:
--
--
Category Low
--
Category High
As of March 31, 2021
Performance Versus Category
As of April 22, 2021. Returns for periods of 1 year and above are annualized.
Annual Total Returns Versus Peers
Edit comparables
As of April 22, 2021.
Asset Allocation
Top 10 Holdings
Name | % Weight | Price | % Change |
---|---|---|---|
Johnson & Johnson | 7.85% | 165.18 | -0.85% |
UnitedHealth Group Inc | 5.93% | 396.54 | -0.57% |
Abbott Laboratories | 3.99% | 123.50 | 0.73% |
AbbVie Inc | 3.58% | 110.05 | -0.68% |
Pfizer Inc | 3.50% | 38.64 | -2.25% |
Merck & Co Inc | 3.46% | 77.96 | -1.60% |
Thermo Fisher Scientific Inc | 3.36% | 484.21 | 0.79% |
Eli Lilly and Co | 3.32% | 187.05 | -2.04% |
Medtronic PLC | 2.96% | 129.85 | -0.31% |
Danaher Corp | 2.64% | 252.92 | 3.49% |
News
Headline
Wire
Time (ET)
MT Newswires
04/22 07:45
MT Newswires
04/21 08:06
MT Newswires
04/20 08:06
MT Newswires
04/19 08:01
MT Newswires
04/16 08:24
MT Newswires
04/15 07:36
MT Newswires
04/14 07:44
MT Newswires
04/12 09:08
Basic Info
Investment Strategy | |
The investment seeks to track the performance of a benchmark index. The fund employs an indexing investment approach designed to track the performance of the MSCI US Investable Market Index (IMI)/Health Care 25/50, an index made up of stocks of large, mid-size, and small U.S. companies within the health care sector, as classified under the Global Industry Classification Standard (GICS). The Advisor attempts to replicate the target index by seeking to invest all, or substantially all, of its assets in the stocks that make up the index, in order to hold each stock in approximately the same proportion as its weighting in the index. The fund is non-diversified. |
General | |
Security Type | Exchange-Traded Fund |
Equity Style | Large Cap/Blend |
Fixed Income Style | -- |
Broad Asset Class | Sector Equity |
Broad Category | Equity |
Category Name | Health |
Category Index | S&P 1500 Health Care TR |
Prospectus Objective | Specialty - Health |
Fund Owner Firm Name | Vanguard |
Prospectus Benchmark Index | |
MSCI US IMI/Health Care 25-50 GR USD | 100.0% |
Broad Asset Class Benchmark Index | |
^MSWNTR | 100.0% |
Manager Tenure | |
Walter Nejman | 5.28 yrs |
Michelle Louie | 3.34 yrs |
Fundamentals
General | |
Distribution Yield | Upgrade |
Dividend Yield TTM (4-22-21) | 1.21% |
30-Day SEC Yield (4-21-21) | Upgrade |
7-Day SEC Yield | -- |
Number of Holdings | Upgrade |
Stock | |
Weighted Average PE Ratio | 27.73 |
Weighted Average Price to Sales Ratio | Upgrade |
Weighted Average Price to Book Ratio | Upgrade |
Weighted Median ROE | Upgrade |
Weighted Median ROA | Upgrade |
Forecasted Dividend Yield | Upgrade |
Forecasted PE Ratio | Upgrade |
Forecasted Price to Sales Ratio | Upgrade |
Forecasted Price to Book Ratio | Upgrade |
As of March 31, 2021
Growth Estimates
Fund Details
Key Dates | |
Inception Date | 1/26/2004 |
Last Annual Report Date | 8/31/2020 |
Last Prospectus Date | 12/22/2020 |
Attributes | |
Enhanced Index Fund | No |
Index Fund |
|
Inverse Fund | No |
Leveraged Fund | No |
Fund of Funds | No |
Currency Hedged Fund | No |
Synthetic Replication Fund | No |
Has Dividend Investment Plan | No |
Socially Responsible Fund | No |
News
Headline
Wire
Time (ET)
MT Newswires
04/22 07:45
MT Newswires
04/21 08:06
MT Newswires
04/20 08:06
MT Newswires
04/19 08:01
MT Newswires
04/16 08:24
MT Newswires
04/15 07:36
MT Newswires
04/14 07:44
MT Newswires
04/12 09:08