

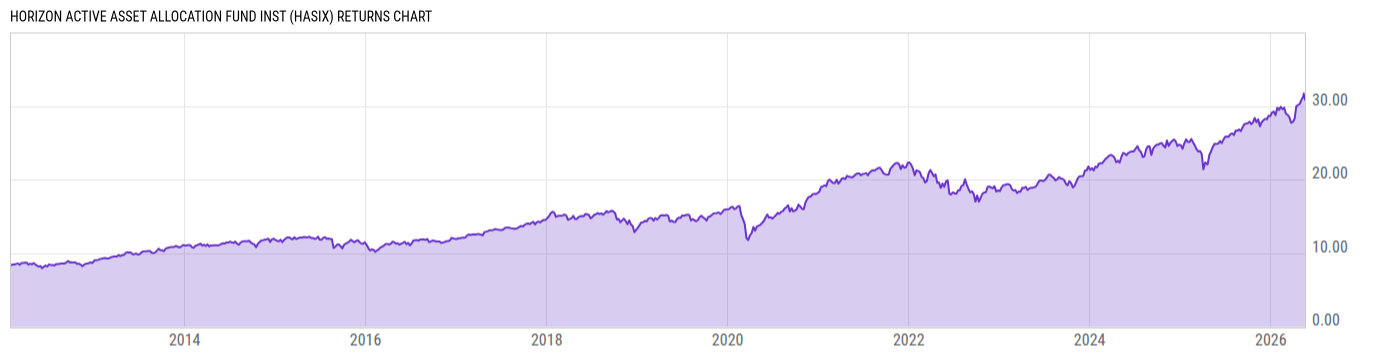
Horizon Active Asset Allocation Fund Inst (HASIX)
16.17
-0.03
(-0.19%)
USD |
Jun 09 2026
Returns Chart
Key Stats
| Net Expense Ratio | Total Assets Under Management | Weighted Average Dividend Yield | Turnover Ratio (Generic) |
|---|---|---|---|
| 1.21% | 757.54M | -- | 90.00% |
| 1 Year Fund Level Flows | 1 Year Total Returns (Daily) | Annualized Total Returns Since Inception (Daily) | Max Drawdown (Since Inception) |
| -147.82M | 23.53% |
Basic Info
| Investment Strategy | |
| The Fund seeks capital appreciation. The Fund invests into various sectors of the global securities markets and ETFs that each invests primarily in at least one of the following; common stock of domestic and foreign issuers, commodities, currencies, bonds from government, corporate, municipal, and REITs. |
| General | |
| Security Type | Mutual Fund |
| Equity Style | -- |
| Broad Asset Class | Allocation |
| Broad Category | Allocation |
| Global Peer Group | Mixed Asset USD Flexible - Global |
| Peer Group | Flexible Portfolio Funds |
| Global Macro | Mixed Asset HC Flexible |
| US Macro | Mixed-Assets Funds |
| YCharts Categorization | -- |
| YCharts Benchmark | -- |
| Prospectus Objective | Flexible Portfolio Funds |
| Fund Owner Firm Name | Horizon Funds |
| Broad Asset Class Benchmark Index | |
| ^SPXTR | 100.0% |
Net Fund Flows Versus Peer Group
1 Month
% Rank:
60
-283.22M
Peer Group Low
1.386B
Peer Group High
1 Year
% Rank:
82
-147.82M
-3.136B
Peer Group Low
12.22B
Peer Group High
3 Months
% Rank:
55
-727.84M
Peer Group Low
12.22B
Peer Group High
3 Years
% Rank:
87
-12.10B
Peer Group Low
12.22B
Peer Group High
6 Months
% Rank:
82
-1.420B
Peer Group Low
12.22B
Peer Group High
5 Years
% Rank:
73
-14.65B
Peer Group Low
12.22B
Peer Group High
YTD
% Rank:
81
-1.211B
Peer Group Low
12.22B
Peer Group High
10 Years
% Rank:
73
-47.19B
Peer Group Low
12.34B
Peer Group High
Date Unavailable
Risk
Performance Versus Peer Group
Annual Total Returns Versus Peers
As of June 10, 2026.
Asset Allocation
As of March 31, 2026.
| Type | % Net |
|---|---|
| Cash | 0.40% |
| Stock | 98.80% |
| Bond | 0.28% |
| Convertible | 0.00% |
| Preferred | 0.26% |
| Other | 0.26% |
Top 10 Holdings
| Name | % Weight | Price | % Change |
|---|---|---|---|
| State Street SPDR Portfolio S&P 500 Growth ETF | 18.39% | 116.56 | -0.65% |
| iShares Core MSCI International Developed Mkt ETF | 17.16% | 88.75 | 0.07% |
| iShares Core MSCI Emerging Markets ETF | 8.39% | 80.04 | 0.09% |
| Avantis International Small Cap Value ETF | 7.71% | 104.40 | -1.76% |
| iShares Core Dividend Growth ETF | 7.03% | 75.33 | 0.51% |
| Invesco S&P 500 Eql Wght ETF | 4.72% | 209.19 | 0.76% |
| State Street SPDR Portfolio Emerging Markets ETF | 3.96% | 51.19 | 0.61% |
| Invesco KBW Bank ETF | 3.94% | 90.19 | 0.84% |
| JPMorgan BetaBuilders Europe ETF | 3.04% | 77.07 | 0.40% |
| iShares MSCI Japan ETF | 3.02% | 90.95 | -1.09% |
Fees & Availability
| Fees | |
| Actual 12B-1 Fee | -- |
| Actual Management Fee | 0.99% |
| Administration Fee | 13.34K% |
| Maximum Front Load | -- |
| Maximum Deferred Load | -- |
| Maximum Redemption Fee | -- |
| General Availability | |
| Available for Insurance Product | No |
| Available for RRSP | No |
| Purchase Details | |
| Open to New Investors |
|
| Minimum Initial Investment | 10.00M None |
| Minimum Subsequent Investment | 0.00 None |
Basic Info
| Investment Strategy | |
| The Fund seeks capital appreciation. The Fund invests into various sectors of the global securities markets and ETFs that each invests primarily in at least one of the following; common stock of domestic and foreign issuers, commodities, currencies, bonds from government, corporate, municipal, and REITs. |
| General | |
| Security Type | Mutual Fund |
| Equity Style | -- |
| Broad Asset Class | Allocation |
| Broad Category | Allocation |
| Global Peer Group | Mixed Asset USD Flexible - Global |
| Peer Group | Flexible Portfolio Funds |
| Global Macro | Mixed Asset HC Flexible |
| US Macro | Mixed-Assets Funds |
| YCharts Categorization | -- |
| YCharts Benchmark | -- |
| Prospectus Objective | Flexible Portfolio Funds |
| Fund Owner Firm Name | Horizon Funds |
| Broad Asset Class Benchmark Index | |
| ^SPXTR | 100.0% |
Fundamentals
| General | |
| Distribution Yield | -- |
| Dividend Yield TTM (6-8-26) | 1.01% |
| 30-Day SEC Yield | -- |
| 7-Day SEC Yield | -- |
| Number of Holdings | 85 |
| Stock | |
| Weighted Average PE Ratio | 26.48 |
| Weighted Average Price to Sales Ratio | 6.189 |
| Weighted Average Price to Book Ratio | 7.375 |
| Weighted Median ROE | 62.65% |
| Weighted Median ROA | 12.75% |
| ROI (TTM) | 18.98% |
| Return on Investment (TTM) | 18.98% |
| Earning Yield | 0.0521 |
| LT Debt / Shareholders Equity | 0.6572 |
| Number of Equity Holdings | 66 |
As of March 31, 2026
Growth Metrics
| EPS Growth (1Y) | 25.12% |
| EPS Growth (3Y) | 18.13% |
| EPS Growth (5Y) | 22.73% |
| Sales Growth (1Y) | 14.23% |
| Sales Growth (3Y) | 13.59% |
| Sales Growth (5Y) | 14.48% |
| Sales per Share Growth (1Y) | 24.68% |
| Sales per Share Growth (3Y) | 14.21% |
| Operating Cash Flow - Growth Rate (3Y) | 24.24% |
As of March 31, 2026
Fund Details
Top Portfolio Holders
| Name | % Weight |
|---|---|
| Portfolio A | 5.00% |
| Portfolio B | 3.50% |
| Portfolio C | 2.25% |
Excel Add-In Codes
| Name: =YCI("M:HASIX", "name") |
| Broad Asset Class: =YCI("M:HASIX", "broad_asset_class") |
| Broad Category: =YCI("M:HASIX", "broad_category_group") |
| Prospectus Objective: =YCI("M:HASIX", "prospectus_objective") |
| To find the codes for any of our securities and financial metrics, see our Complete Excel Reference. |