

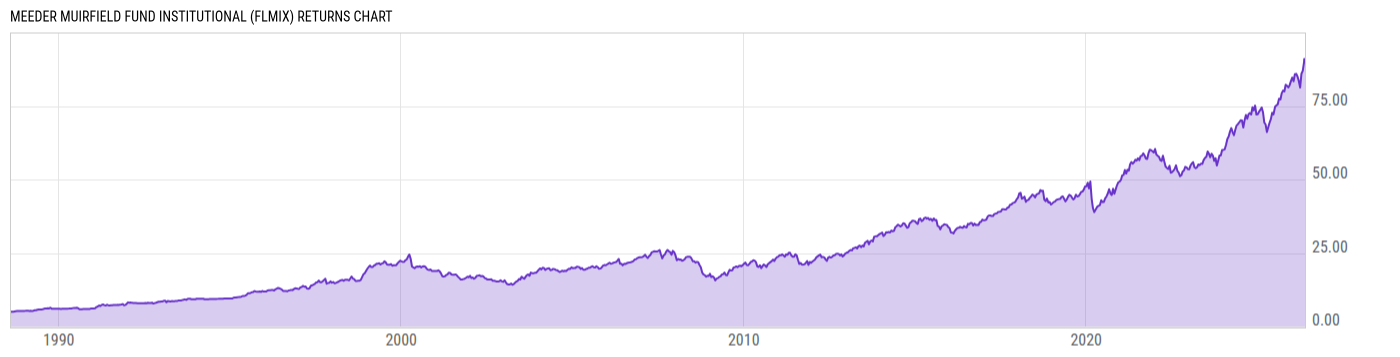
Meeder Muirfield Fund Institutional (FLMIX)
11.15
+0.05
(+0.45%)
USD |
May 22 2026
Returns Chart
Key Stats
| Net Expense Ratio | Total Assets Under Management | Weighted Average Dividend Yield | Turnover Ratio (Generic) |
|---|---|---|---|
| 0.91% | 1.251B | 0.99% | 307.0% |
| 1 Year Fund Level Flows | 1 Year Total Returns (Daily) | Annualized Total Returns Since Inception (Daily) | Max Drawdown (Since Inception) |
| 35.20M | 27.88% |
Basic Info
| Investment Strategy | |
| The Fund seeks to provide long-term capital appreciation. The Fund invests primarily in common and preferred stocks. The Fund may also invest in equity investment companies, which include domestic and foreign mutual funds, which may invest in emerging markets, as well as in ETFs, closed-end funds, and UITs. |
| General | |
| Security Type | Mutual Fund |
| Equity Style | Multi Cap Core |
| Broad Asset Class | Allocation |
| Broad Category | Allocation |
| Global Peer Group | Mixed Asset USD Flexible - US |
| Peer Group | Flexible Portfolio Funds |
| Global Macro | Mixed Asset HC Flexible |
| US Macro | Mixed-Assets Funds |
| YCharts Categorization | -- |
| YCharts Benchmark | -- |
| Prospectus Objective | Flexible Portfolio Funds |
| Fund Owner Firm Name | Meeder |
| Broad Asset Class Benchmark Index | |
| ^SPXTR | 100.0% |
Net Fund Flows Versus Peer Group
1 Month
% Rank:
18
-159.25M
Peer Group Low
5.297B
Peer Group High
1 Year
% Rank:
16
35.20M
-3.214B
Peer Group Low
5.297B
Peer Group High
3 Months
% Rank:
14
-582.29M
Peer Group Low
5.297B
Peer Group High
3 Years
% Rank:
9
-12.12B
Peer Group Low
5.297B
Peer Group High
6 Months
% Rank:
14
-1.396B
Peer Group Low
5.297B
Peer Group High
5 Years
% Rank:
11
-14.74B
Peer Group Low
5.297B
Peer Group High
YTD
% Rank:
14
-927.39M
Peer Group Low
5.297B
Peer Group High
10 Years
% Rank:
20
-47.38B
Peer Group Low
9.619B
Peer Group High
Date Unavailable
Risk
Performance Versus Peer Group
Annual Total Returns Versus Peers
As of May 23, 2026.
Asset Allocation
As of April 30, 2026.
| Type | % Net |
|---|---|
| Cash | 3.68% |
| Stock | 67.77% |
| Bond | 25.58% |
| Convertible | 0.00% |
| Preferred | 0.00% |
| Other | 2.97% |
Top 10 Holdings
| Name | % Weight | Price | % Change |
|---|---|---|---|
| Meeder Government Money Market Fund F | 29.23% | 1.00 | 0.00% |
| NVIDIA Corp. | 5.28% | 215.33 | -1.90% |
| Alphabet, Inc. | 5.21% | 379.38 | -1.07% |
| Apple, Inc. | 4.76% | 308.82 | 1.26% |
| Microsoft Corp. | 4.36% | 418.57 | -0.12% |
| Mastercard, Inc. | 2.23% | 498.54 | -0.22% |
| Meta Platforms, Inc. | 1.98% | 610.26 | 0.47% |
|
OTHER ASSETS LESS LIABILITIES
|
1.73% | -- | -- |
| Johnson & Johnson | 1.34% | 234.34 | 1.13% |
| Berkshire Hathaway, Inc. | 1.20% | 486.38 | 1.33% |
Fees & Availability
| Fees | |
| Actual 12B-1 Fee | -- |
| Actual Management Fee | 0.63% |
| Administration Fee | 454.3K% |
| Maximum Front Load | -- |
| Maximum Deferred Load | -- |
| Maximum Redemption Fee | -- |
| General Availability | |
| Available for Insurance Product | No |
| Available for RRSP | No |
| Purchase Details | |
| Open to New Investors |
|
| Minimum Initial Investment | 1.00M None |
| Minimum Subsequent Investment | 100.00 None |
Basic Info
| Investment Strategy | |
| The Fund seeks to provide long-term capital appreciation. The Fund invests primarily in common and preferred stocks. The Fund may also invest in equity investment companies, which include domestic and foreign mutual funds, which may invest in emerging markets, as well as in ETFs, closed-end funds, and UITs. |
| General | |
| Security Type | Mutual Fund |
| Equity Style | Multi Cap Core |
| Broad Asset Class | Allocation |
| Broad Category | Allocation |
| Global Peer Group | Mixed Asset USD Flexible - US |
| Peer Group | Flexible Portfolio Funds |
| Global Macro | Mixed Asset HC Flexible |
| US Macro | Mixed-Assets Funds |
| YCharts Categorization | -- |
| YCharts Benchmark | -- |
| Prospectus Objective | Flexible Portfolio Funds |
| Fund Owner Firm Name | Meeder |
| Broad Asset Class Benchmark Index | |
| ^SPXTR | 100.0% |
Fundamentals
| General | |
| Distribution Yield | -- |
| Dividend Yield TTM (5-21-26) | 0.97% |
| 30-Day SEC Yield | -- |
| 7-Day SEC Yield | -- |
| Number of Holdings | 10 |
| Stock | |
| Weighted Average PE Ratio | 28.29 |
| Weighted Average Price to Sales Ratio | 8.129 |
| Weighted Average Price to Book Ratio | 11.34 |
| Weighted Median ROE | 128.7% |
| Weighted Median ROA | 20.59% |
| ROI (TTM) | 30.25% |
| Return on Investment (TTM) | 30.25% |
| Earning Yield | 0.0463 |
| LT Debt / Shareholders Equity | 0.7778 |
| Number of Equity Holdings | 8 |
| Bond | |
| Yield to Maturity (4-30-26) | 4.94% |
| Effective Duration | -- |
| Average Coupon | 4.45% |
| Calculated Average Quality | 2.883 |
| Effective Maturity | 15.06 |
| Nominal Maturity | 15.43 |
| Number of Bond Holdings | 0 |
As of April 30, 2026
Growth Metrics
| EPS Growth (1Y) | 30.13% |
| EPS Growth (3Y) | 21.54% |
| EPS Growth (5Y) | 26.20% |
| Sales Growth (1Y) | 16.11% |
| Sales Growth (3Y) | 15.20% |
| Sales Growth (5Y) | 16.06% |
| Sales per Share Growth (1Y) | 17.74% |
| Sales per Share Growth (3Y) | 16.63% |
| Operating Cash Flow - Growth Rate (3Y) | 24.82% |
As of April 30, 2026
Top Portfolio Holders
| Name | % Weight |
|---|---|
| Portfolio A | 5.00% |
| Portfolio B | 3.50% |
| Portfolio C | 2.25% |
Excel Add-In Codes
| Name: =YCI("M:FLMIX", "name") |
| Broad Asset Class: =YCI("M:FLMIX", "broad_asset_class") |
| Broad Category: =YCI("M:FLMIX", "broad_category_group") |
| Prospectus Objective: =YCI("M:FLMIX", "prospectus_objective") |
| To find the codes for any of our securities and financial metrics, see our Complete Excel Reference. |