

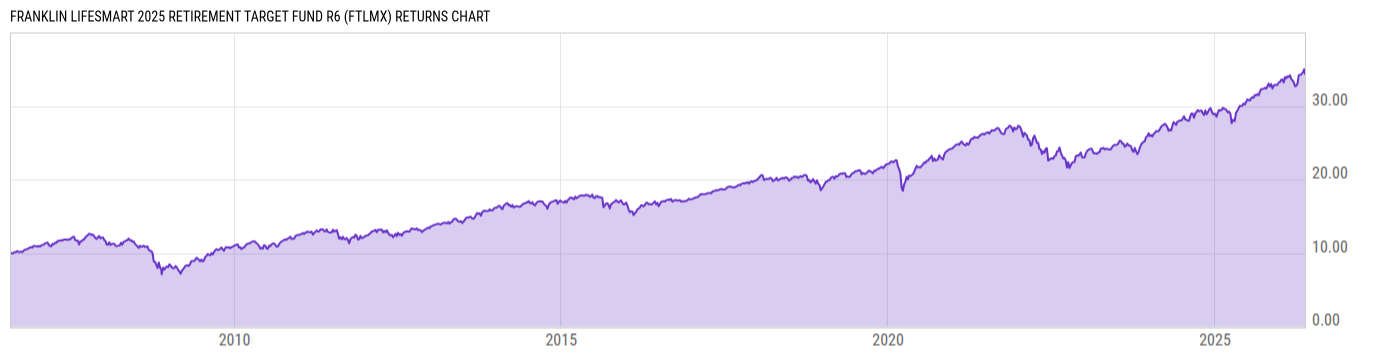
Franklin LifeSmart 2025 Retirement Target Fund R6 (FTLMX)
14.41
+0.01
(+0.07%)
USD |
Jun 09 2026
Returns Chart
Key Stats
| Net Expense Ratio | Total Assets Under Management | Weighted Average Dividend Yield | Turnover Ratio (Generic) |
|---|---|---|---|
| 0.40% | 114.52M | -- | 21.00% |
| 1 Year Fund Level Flows | 1 Year Total Returns (Daily) | Annualized Total Returns Since Inception (Daily) | Max Drawdown (Since Inception) |
| -11.24M | 15.17% |
Basic Info
| Investment Strategy | |
| The Fund seeks the highest level of long-term total return, consisting of both capital appreciation and income, consistent with its asset allocation. The Fund invests in the broad asset classes of equity, fixed-income and short-term investments through weighted combinations of Franklin Templeton mutual funds. |
| General | |
| Security Type | Mutual Fund |
| Equity Style | -- |
| Broad Asset Class | Allocation |
| Broad Category | Allocation |
| Global Peer Group | Target Maturity MA USD 2025 |
| Peer Group | Mixed-Asset Target 2025 Funds |
| Global Macro | Target Maturity |
| US Macro | Mixed-Assets Target Date Funds |
| YCharts Categorization | -- |
| YCharts Benchmark | -- |
| Prospectus Objective | Growth & Income Funds |
| Fund Owner Firm Name | Franklin Templeton |
| Broad Asset Class Benchmark Index | |
| ^SPXTR | 100.0% |
Net Fund Flows Versus Peer Group
1 Month
% Rank:
22
-1.102B
Peer Group Low
129.23M
Peer Group High
1 Year
% Rank:
25
-11.24M
-9.196B
Peer Group Low
486.89M
Peer Group High
3 Months
% Rank:
21
-2.501B
Peer Group Low
168.36M
Peer Group High
3 Years
% Rank:
37
-24.95B
Peer Group Low
975.77M
Peer Group High
6 Months
% Rank:
18
-4.802B
Peer Group Low
335.21M
Peer Group High
5 Years
% Rank:
38
-40.09B
Peer Group Low
1.084B
Peer Group High
YTD
% Rank:
18
-4.274B
Peer Group Low
282.43M
Peer Group High
10 Years
% Rank:
65
-46.59B
Peer Group Low
6.980B
Peer Group High
Date Unavailable
Risk
Performance Versus Peer Group
Annual Total Returns Versus Peers
As of June 10, 2026.
Asset Allocation
As of April 30, 2026.
| Type | % Net |
|---|---|
| Cash | 0.56% |
| Stock | 25.42% |
| Bond | 44.07% |
| Convertible | 0.00% |
| Preferred | 0.13% |
| Other | 29.82% |
Top 10 Holdings
| Name | % Weight | Price | % Change |
|---|---|---|---|
| Franklin US Core Bond ETF | 19.56% | 21.26 | -0.07% |
| Franklin U.S. Core Equity Advisor | 16.14% | 20.96 | -0.24% |
| Franklin Investment Grade Corporate ETF | 9.07% | 21.28 | -0.21% |
| Franklin US Treasury Bond ETF | 8.48% | 20.14 | -0.05% |
| Franklin International Core Equity Adv | 6.66% | 14.53 | -0.07% |
| Putnam Large Cap Value Fund R6 | 4.30% | 42.93 | 0.35% |
| Franklin US Large Cap Multifactor Index ETF | 4.03% | 76.33 | -0.09% |
| Franklin Emerging Market Core Equity Adv | 3.97% | 16.06 | 0.88% |
| Franklin Growth Fund R6 | 3.87% | 142.76 | 0.39% |
| Franklin High Yield Corporate ETF | 3.30% | 24.15 | -0.17% |
Fees & Availability
| Fees | |
| Actual 12B-1 Fee | -- |
| Actual Management Fee | 0.01% |
| Administration Fee | -- |
| Maximum Front Load | -- |
| Maximum Deferred Load | -- |
| Maximum Redemption Fee | -- |
| General Availability | |
| Available for Insurance Product | No |
| Available for RRSP | No |
| Purchase Details | |
| Open to New Investors |
|
| Minimum Initial Investment | 1.00M None |
| Minimum Subsequent Investment | 0.00 None |
Basic Info
| Investment Strategy | |
| The Fund seeks the highest level of long-term total return, consisting of both capital appreciation and income, consistent with its asset allocation. The Fund invests in the broad asset classes of equity, fixed-income and short-term investments through weighted combinations of Franklin Templeton mutual funds. |
| General | |
| Security Type | Mutual Fund |
| Equity Style | -- |
| Broad Asset Class | Allocation |
| Broad Category | Allocation |
| Global Peer Group | Target Maturity MA USD 2025 |
| Peer Group | Mixed-Asset Target 2025 Funds |
| Global Macro | Target Maturity |
| US Macro | Mixed-Assets Target Date Funds |
| YCharts Categorization | -- |
| YCharts Benchmark | -- |
| Prospectus Objective | Growth & Income Funds |
| Fund Owner Firm Name | Franklin Templeton |
| Broad Asset Class Benchmark Index | |
| ^SPXTR | 100.0% |
Fundamentals
| General | |
| Distribution Yield | -- |
| Dividend Yield TTM (6-8-26) | 2.97% |
| 30-Day SEC Yield | -- |
| 7-Day SEC Yield | -- |
| Number of Holdings | 10 |
| Stock | |
| Weighted Average PE Ratio | 30.48 |
| Weighted Average Price to Sales Ratio | 7.554 |
| Weighted Average Price to Book Ratio | 8.830 |
| Weighted Median ROE | 78.16% |
| Weighted Median ROA | 14.73% |
| ROI (TTM) | 21.39% |
| Return on Investment (TTM) | 21.39% |
| Earning Yield | 0.0432 |
| LT Debt / Shareholders Equity | 0.7114 |
| Number of Equity Holdings | 0 |
| Bond | |
| Yield to Maturity (4-30-26) | 4.75% |
| Effective Duration | -- |
| Average Coupon | 4.08% |
| Calculated Average Quality | 2.858 |
| Effective Maturity | 11.56 |
| Nominal Maturity | 11.66 |
| Number of Bond Holdings | 0 |
As of April 30, 2026
Growth Metrics
| EPS Growth (1Y) | 26.82% |
| EPS Growth (3Y) | 17.11% |
| EPS Growth (5Y) | 22.23% |
| Sales Growth (1Y) | 14.23% |
| Sales Growth (3Y) | 12.25% |
| Sales Growth (5Y) | 14.48% |
| Sales per Share Growth (1Y) | 15.77% |
| Sales per Share Growth (3Y) | 13.12% |
| Operating Cash Flow - Growth Rate (3Y) | 19.20% |
As of April 30, 2026
Top Portfolio Holders
| Name | % Weight |
|---|---|
| Portfolio A | 5.00% |
| Portfolio B | 3.50% |
| Portfolio C | 2.25% |
Excel Add-In Codes
| Name: =YCI("M:FTLMX", "name") |
| Broad Asset Class: =YCI("M:FTLMX", "broad_asset_class") |
| Broad Category: =YCI("M:FTLMX", "broad_category_group") |
| Prospectus Objective: =YCI("M:FTLMX", "prospectus_objective") |
| To find the codes for any of our securities and financial metrics, see our Complete Excel Reference. |