

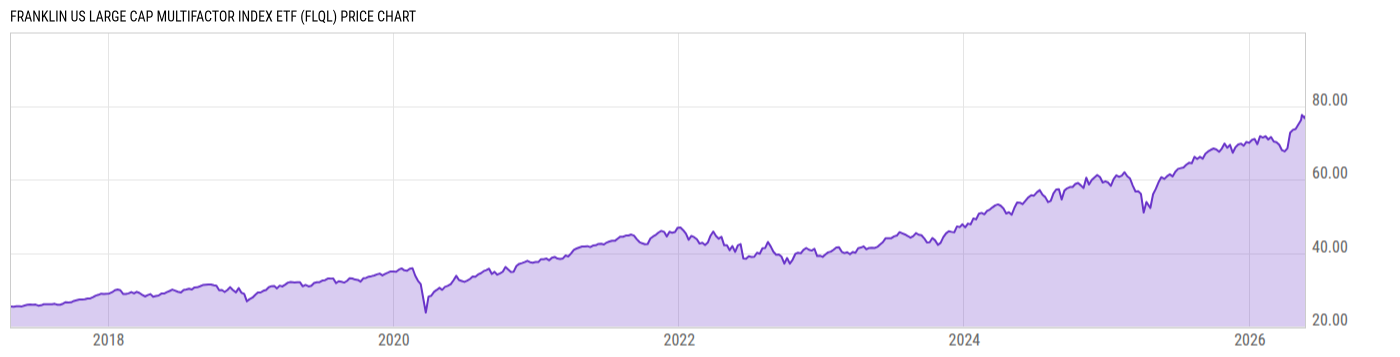
Franklin US Large Cap Multifactor Index ETF (FLQL)
76.69
+0.43
(+0.56%)
USD |
BATS |
Jun 08, 16:00
76.69
0.00 (0.00%)
After-Hours: 16:45
Price Chart
Key Stats
| Net Expense Ratio | Discount or Premium to NAV | Total Assets Under Management | 30-Day Average Daily Volume |
|---|---|---|---|
| 0.15% | 0.10% | 1.985B | 83160.17 |
| Weighted Average Dividend Yield | Turnover Ratio (Generic) | 1 Year Fund Level Flows | Max Drawdown (Since Inception) |
| 1.27% | 53.00% | 121.21M |
Basic Info
| Investment Strategy | |
| The Fund seeks to provide investment results that closely correspond to the performance of the LibertyQ US Large Cap Equity Index. The Fund invests 80% of its assets in the components of the underlying index based on Russell 1000 index, designed to measure the performance of large capitalization stocks in the US. |
| General | |
| Security Type | Exchange-Traded Fund |
| Equity Style | Large Cap Core |
| Broad Asset Class | US Equity |
| Broad Category | Equity |
| Global Peer Group | Equity US |
| Peer Group | Large-Cap Core Funds |
| Global Macro | Equity North America |
| US Macro | Large-Cap Funds |
| YCharts Categorization | -- |
| YCharts Benchmark | -- |
| Prospectus Objective | Growth & Income Funds |
| Fund Owner Firm Name | Franklin Templeton |
| Broad Asset Class Benchmark Index | |
| ^SPXTR | 100.0% |
Performance Versus Peer Group
Annual Total Returns Versus Peers
As of June 08, 2026.
Asset Allocation
As of April 30, 2026.
| Type | % Net |
|---|---|
| Cash | 0.00% |
| Stock | 99.86% |
| Bond | 0.00% |
| Convertible | 0.00% |
| Preferred | 0.00% |
| Other | 0.13% |
Basic Info
| Investment Strategy | |
| The Fund seeks to provide investment results that closely correspond to the performance of the LibertyQ US Large Cap Equity Index. The Fund invests 80% of its assets in the components of the underlying index based on Russell 1000 index, designed to measure the performance of large capitalization stocks in the US. |
| General | |
| Security Type | Exchange-Traded Fund |
| Equity Style | Large Cap Core |
| Broad Asset Class | US Equity |
| Broad Category | Equity |
| Global Peer Group | Equity US |
| Peer Group | Large-Cap Core Funds |
| Global Macro | Equity North America |
| US Macro | Large-Cap Funds |
| YCharts Categorization | -- |
| YCharts Benchmark | -- |
| Prospectus Objective | Growth & Income Funds |
| Fund Owner Firm Name | Franklin Templeton |
| Broad Asset Class Benchmark Index | |
| ^SPXTR | 100.0% |