

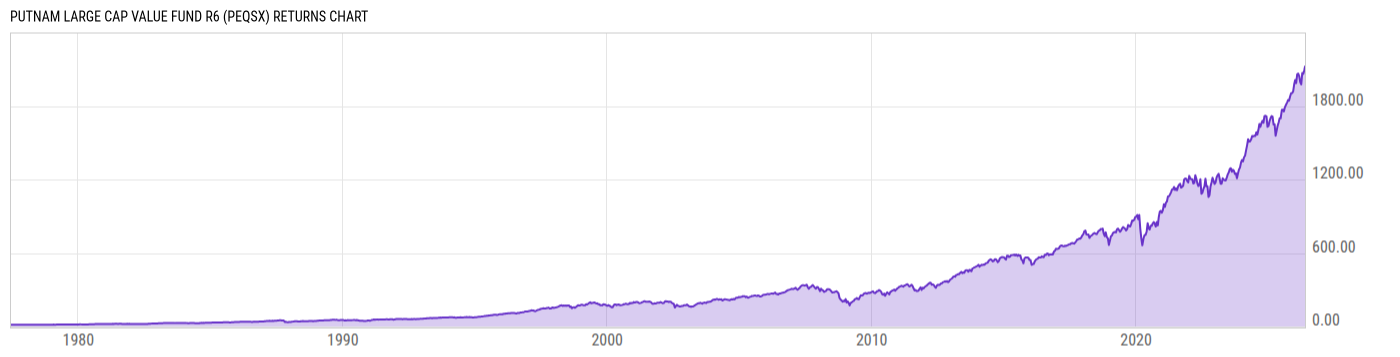
Putnam Large Cap Value Fund R6 (PEQSX)
42.39
+0.22
(+0.52%)
USD |
May 22 2026
Returns Chart
Key Stats
| Net Expense Ratio | Total Assets Under Management | Weighted Average Dividend Yield | Turnover Ratio (Generic) |
|---|---|---|---|
| 0.52% | 50.98B | 1.70% | 18.00% |
| 1 Year Fund Level Flows | 1 Year Total Returns (Daily) | Annualized Total Returns Since Inception (Daily) | Max Drawdown (Since Inception) |
| 3.743B | 27.20% |
Basic Info
| Investment Strategy | |
| The Fund seeks seeks capital growth and current income. The Fund invests in common stocks of U.S. companies, with a focus on value stocks. It invest at least 80% of the funds net assets in large-cap companies, which, for purposes of this policy, are of a size similar to those in the Russell 1000 Value Index. |
| General | |
| Security Type | Mutual Fund |
| Equity Style | Multi Cap Value |
| Broad Asset Class | US Equity |
| Broad Category | Equity |
| Global Peer Group | Equity US |
| Peer Group | Large-Cap Value Funds |
| Global Macro | Equity North America |
| US Macro | Large-Cap Funds |
| YCharts Categorization | -- |
| YCharts Benchmark | -- |
| Prospectus Objective | Growth & Income Funds |
| Fund Owner Firm Name | Franklin Templeton |
| Broad Asset Class Benchmark Index | |
| ^SPXTR | 100.0% |
Net Fund Flows Versus Peer Group
1 Month
% Rank:
85
-2.064B
Peer Group Low
712.30M
Peer Group High
1 Year
% Rank:
2
3.743B
-10.92B
Peer Group Low
3.743B
Peer Group High
3 Months
% Rank:
2
-4.066B
Peer Group Low
1.385B
Peer Group High
3 Years
% Rank:
2
-30.39B
Peer Group Low
14.13B
Peer Group High
6 Months
% Rank:
2
-7.282B
Peer Group Low
3.021B
Peer Group High
5 Years
% Rank:
2
-40.74B
Peer Group Low
15.12B
Peer Group High
YTD
% Rank:
2
-5.212B
Peer Group Low
1.984B
Peer Group High
10 Years
% Rank:
2
-42.02B
Peer Group Low
14.13B
Peer Group High
Date Unavailable
Risk
Performance Versus Peer Group
Annual Total Returns Versus Peers
As of May 23, 2026.
Asset Allocation
As of March 31, 2026.
| Type | % Net |
|---|---|
| Cash | 2.66% |
| Stock | 96.51% |
| Bond | 0.34% |
| Convertible | 0.00% |
| Preferred | 0.00% |
| Other | 0.49% |
Top 10 Holdings
| Name | % Weight | Price | % Change |
|---|---|---|---|
| Citigroup, Inc. | 3.95% | 125.09 | -0.10% |
| Alphabet, Inc. | 3.56% | 382.97 | -1.21% |
| Exxon Mobil Corp. | 3.46% | 154.92 | -0.24% |
| Cisco Systems, Inc. | 3.09% | 120.41 | 1.87% |
| NextEra Energy, Inc. | 2.48% | 88.55 | -1.27% |
| The Coca-Cola Co. | 2.40% | 81.48 | 0.38% |
| Philip Morris International, Inc. | 2.36% | 188.99 | 0.28% |
| General Motors Co. | 2.31% | 78.79 | 2.05% |
| McKesson Corp. | 2.24% | 766.08 | -0.05% |
| Amazon.com, Inc. | 2.13% | 266.32 | -0.80% |
Fees & Availability
| Fees | |
| Actual 12B-1 Fee | -- |
| Actual Management Fee | 0.46% |
| Administration Fee | -- |
| Maximum Front Load | -- |
| Maximum Deferred Load | -- |
| Maximum Redemption Fee | -- |
| General Availability | |
| Available for Insurance Product | No |
| Available for RRSP | No |
| Purchase Details | |
| Open to New Investors |
|
| Minimum Initial Investment | 500.00 None |
| Minimum Subsequent Investment | 0.00 None |
Basic Info
| Investment Strategy | |
| The Fund seeks seeks capital growth and current income. The Fund invests in common stocks of U.S. companies, with a focus on value stocks. It invest at least 80% of the funds net assets in large-cap companies, which, for purposes of this policy, are of a size similar to those in the Russell 1000 Value Index. |
| General | |
| Security Type | Mutual Fund |
| Equity Style | Multi Cap Value |
| Broad Asset Class | US Equity |
| Broad Category | Equity |
| Global Peer Group | Equity US |
| Peer Group | Large-Cap Value Funds |
| Global Macro | Equity North America |
| US Macro | Large-Cap Funds |
| YCharts Categorization | -- |
| YCharts Benchmark | -- |
| Prospectus Objective | Growth & Income Funds |
| Fund Owner Firm Name | Franklin Templeton |
| Broad Asset Class Benchmark Index | |
| ^SPXTR | 100.0% |
Fundamentals
| General | |
| Distribution Yield | -- |
| Dividend Yield TTM (5-21-26) | 1.27% |
| 30-Day SEC Yield (3-31-26) | 1.32% |
| 7-Day SEC Yield | -- |
| Number of Holdings | 115 |
| Stock | |
| Weighted Average PE Ratio | 26.71 |
| Weighted Average Price to Sales Ratio | 3.923 |
| Weighted Average Price to Book Ratio | 4.528 |
| Weighted Median ROE | 81.56% |
| Weighted Median ROA | 7.33% |
| ROI (TTM) | 12.86% |
| Return on Investment (TTM) | 12.86% |
| Earning Yield | 0.0463 |
| LT Debt / Shareholders Equity | 0.7016 |
| Number of Equity Holdings | 69 |
As of March 31, 2026
Growth Metrics
| EPS Growth (1Y) | 11.37% |
| EPS Growth (3Y) | 4.95% |
| EPS Growth (5Y) | 12.63% |
| Sales Growth (1Y) | 7.09% |
| Sales Growth (3Y) | 5.42% |
| Sales Growth (5Y) | 10.12% |
| Sales per Share Growth (1Y) | 8.74% |
| Sales per Share Growth (3Y) | 7.35% |
| Operating Cash Flow - Growth Rate (3Y) | 10.25% |
As of March 31, 2026
Fund Details
| Key Dates | |
| Inception Date | 6/15/1977 |
| Last Annual Report Date | 10/31/2025 |
| Last Prospectus Date | 2/28/2025 |
| Share Classes | |
| PEIYX | Inst |
| PEQCX | C |
| PEQLX | Retirement |
| PEQRX | Retirement |
| PEYAX | A |
| Attributes | |
| Index Fund | -- |
| Inverse Fund | No |
| Leveraged Fund | -- |
| Fund of Funds | No |
| Currency Hedged Fund | -- |
| Socially Responsible Fund | No |
Top Portfolio Holders
| Name | % Weight |
|---|---|
| Portfolio A | 5.00% |
| Portfolio B | 3.50% |
| Portfolio C | 2.25% |
Excel Add-In Codes
| Name: =YCI("M:PEQSX", "name") |
| Broad Asset Class: =YCI("M:PEQSX", "broad_asset_class") |
| Broad Category: =YCI("M:PEQSX", "broad_category_group") |
| Prospectus Objective: =YCI("M:PEQSX", "prospectus_objective") |
| To find the codes for any of our securities and financial metrics, see our Complete Excel Reference. |