

Franklin LifeSmart 2050 Retirement Target Fund C (FLSKX)
18.51
+0.04
(+0.22%)
USD |
May 22 2026
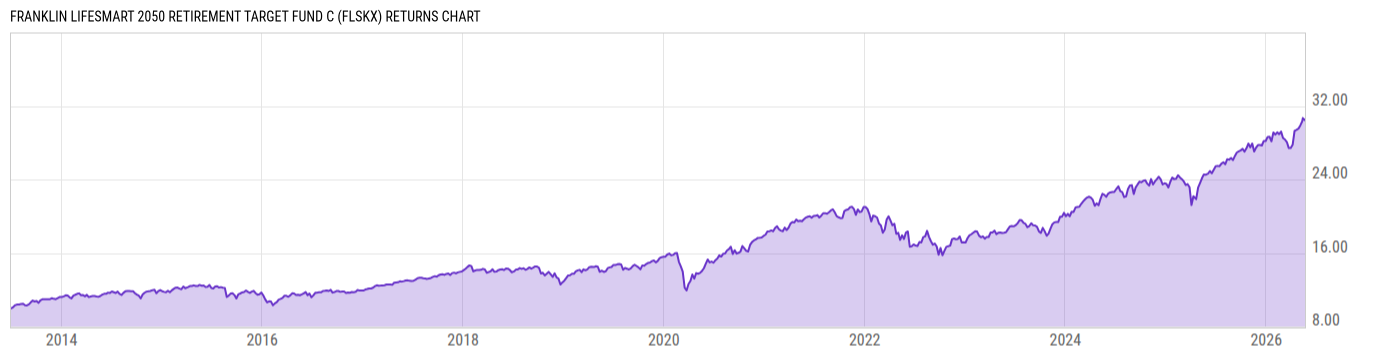
Returns Chart
Key Stats
| Net Expense Ratio | Total Assets Under Management | Weighted Average Dividend Yield | Turnover Ratio (Generic) |
|---|---|---|---|
| 1.45% | 73.06M | -- | 26.00% |
| 1 Year Fund Level Flows | 1 Year Total Returns (Daily) | Annualized Total Returns Since Inception (Daily) | Max Drawdown (Since Inception) |
| 1.071M | 26.04% |
Basic Info
| Investment Strategy | |
| The Fund seeks the highest level of long-term total return in its asset allocation. The Fund employs an asset allocation strategy designed for investors who are expecting to retire around the year 2050. At around the target date, the Fund's final asset allocation will be 32% equity funds and 68% fixed income funds. |
| General | |
| Security Type | Mutual Fund |
| Equity Style | -- |
| Broad Asset Class | Allocation |
| Broad Category | Allocation |
| Global Peer Group | Target Maturity MA USD 2050 |
| Peer Group | Mixed-Asset Target 2050 Funds |
| Global Macro | Target Maturity |
| US Macro | Mixed-Assets Target Date Funds |
| YCharts Categorization | -- |
| YCharts Benchmark | -- |
| Prospectus Objective | Growth Funds |
| Fund Owner Firm Name | Franklin Templeton |
| Broad Asset Class Benchmark Index | |
| ^SPXTR | 100.0% |
Net Fund Flows Versus Peer Group
1 Month
% Rank:
50
-391.01M
Peer Group Low
450.45M
Peer Group High
1 Year
% Rank:
48
1.071M
-1.669B
Peer Group Low
3.567B
Peer Group High
3 Months
% Rank:
33
-702.78M
Peer Group Low
1.524B
Peer Group High
3 Years
% Rank:
55
-2.227B
Peer Group Low
10.50B
Peer Group High
6 Months
% Rank:
39
-1.001B
Peer Group Low
2.087B
Peer Group High
5 Years
% Rank:
72
-3.640B
Peer Group Low
11.92B
Peer Group High
YTD
% Rank:
33
-595.70M
Peer Group Low
1.524B
Peer Group High
10 Years
% Rank:
75
-6.982B
Peer Group Low
17.75B
Peer Group High
Date Unavailable
Risk
Performance Versus Peer Group
Annual Total Returns Versus Peers
As of May 23, 2026.
Asset Allocation
As of March 31, 2026.
| Type | % Net |
|---|---|
| Cash | 0.33% |
| Stock | 51.90% |
| Bond | 3.12% |
| Convertible | 0.00% |
| Preferred | 0.22% |
| Other | 44.43% |
Top 10 Holdings
| Name | % Weight | Price | % Change |
|---|---|---|---|
| Franklin U.S. Core Equity Advisor | 22.46% | 21.21 | 0.38% |
| Franklin International Core Equity Adv | 11.86% | 14.65 | 0.00% |
| Franklin US Equity Index ETF | 11.09% | 65.15 | 0.42% |
| Putnam Large Cap Value Fund R6 | 7.59% | 42.39 | 0.52% |
| Franklin Growth Fund R6 | 7.37% | 143.47 | 0.30% |
| Franklin US Large Cap Multifactor Index ETF | 7.20% | 77.15 | 0.60% |
| Franklin Emerging Market Core Equity Adv | 6.43% | 15.98 | -0.19% |
| Putnam Large Cap Growth Fund R6 | 5.44% | 88.19 | 0.19% |
| Templeton Developing Markets Trust R6 | 4.87% | 34.33 | -0.26% |
| Franklin FTSE Japan ETF | 3.76% | 39.24 | 0.36% |
Fees & Availability
| Fees | |
| Actual 12B-1 Fee | 1.00% |
| Actual Management Fee | -- |
| Administration Fee | -- |
| Maximum Front Load | 0.00% |
| Maximum Deferred Load | 1.00% |
| Maximum Redemption Fee | -- |
| General Availability | |
| Available for Insurance Product | -- |
| Available for RRSP | -- |
| Purchase Details | |
| Open to New Investors |
|
| Minimum Initial Investment | 1000.00 None |
| Minimum Subsequent Investment | 0.00 None |
Basic Info
| Investment Strategy | |
| The Fund seeks the highest level of long-term total return in its asset allocation. The Fund employs an asset allocation strategy designed for investors who are expecting to retire around the year 2050. At around the target date, the Fund's final asset allocation will be 32% equity funds and 68% fixed income funds. |
| General | |
| Security Type | Mutual Fund |
| Equity Style | -- |
| Broad Asset Class | Allocation |
| Broad Category | Allocation |
| Global Peer Group | Target Maturity MA USD 2050 |
| Peer Group | Mixed-Asset Target 2050 Funds |
| Global Macro | Target Maturity |
| US Macro | Mixed-Assets Target Date Funds |
| YCharts Categorization | -- |
| YCharts Benchmark | -- |
| Prospectus Objective | Growth Funds |
| Fund Owner Firm Name | Franklin Templeton |
| Broad Asset Class Benchmark Index | |
| ^SPXTR | 100.0% |
Fundamentals
| General | |
| Distribution Yield | -- |
| Dividend Yield TTM (5-21-26) | 0.99% |
| 30-Day SEC Yield | -- |
| 7-Day SEC Yield | -- |
| Number of Holdings | 10 |
Fund Details
Top Portfolio Holders
| Name | % Weight |
|---|---|
| Portfolio A | 5.00% |
| Portfolio B | 3.50% |
| Portfolio C | 2.25% |
Excel Add-In Codes
| Name: =YCI("M:FLSKX", "name") |
| Broad Asset Class: =YCI("M:FLSKX", "broad_asset_class") |
| Broad Category: =YCI("M:FLSKX", "broad_category_group") |
| Prospectus Objective: =YCI("M:FLSKX", "prospectus_objective") |
| To find the codes for any of our securities and financial metrics, see our Complete Excel Reference. |