

Nike Inc Cl B (NKE) - Greater China EBIT (I:NICBFLCE)
Level Chart
Basic Info
|
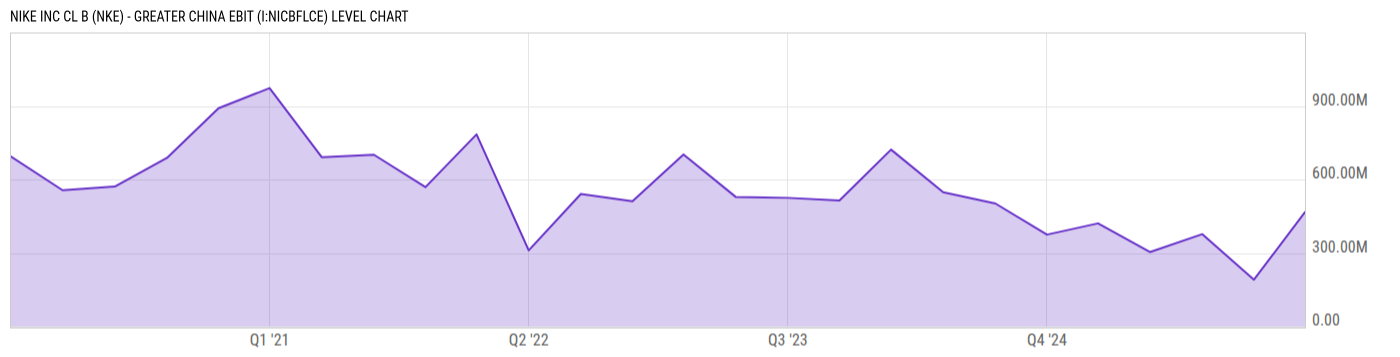
Nike Inc Cl B (NKE) - Greater China EBIT is at a current level of 467.00M, up from 191.00M last quarter and up from 421.00M one year ago. This is a change of 144.5% from last quarter and 10.93% from one year ago. |
|
Nike Inc Cl B Greater China EBIT represents the earnings generated from its operations within Mainland China, Hong Kong, Taiwan, and Macau. |
| Report | Fiscal.ai |
| Category | Segments & KPIs |
| Region | United States |
| Source | Fiscal.ai |
|
Data provided via Fiscal.ai |
Stats
| Last Value | 467.00M |
| Latest Period | Feb 2026 |
| Last Updated | Apr 15 2026, 08:34 EDT |
| Next Release | Jul 15 2026, 08:30 EDT (E) |
| Average Growth Rate | 22.04% |
| Value from Last Quarter | 191.00M |
| Change from Last Quarter | 144.5% |
| Value from 1 Year Ago | 421.00M |
| Change from 1 Year Ago | 10.93% |
| Frequency | Quarterly |
| Unit | USD |
| Adjustment | N/A |
| Download Source File |
Historical Data
| Date | Value |
|---|---|
| February 28, 2026 | 467.00M |
| November 30, 2025 | 191.00M |
| August 31, 2025 | 377.00M |
| May 31, 2025 | 304.00M |
| February 28, 2025 | 421.00M |
| November 30, 2024 | 375.00M |
| August 31, 2024 | 502.00M |
| May 31, 2024 | 548.00M |
| February 29, 2024 | 722.00M |
| November 30, 2023 | 514.00M |
| August 31, 2023 | 525.00M |
| May 31, 2023 | 529.00M |
| February 28, 2023 | 702.00M |
| Date | Value |
|---|---|
| November 30, 2022 | 511.00M |
| August 31, 2022 | 541.00M |
| May 31, 2022 | 311.00M |
| February 28, 2022 | 784.00M |
| November 30, 2021 | 569.00M |
| August 31, 2021 | 701.00M |
| May 31, 2021 | 691.00M |
| February 28, 2021 | 973.00M |
| November 30, 2020 | 891.00M |
| August 31, 2020 | 688.00M |
| May 31, 2020 | 571.00M |
| February 29, 2020 | 556.00M |
| November 30, 2019 | 694.00M |
News
Basic Info
|
Nike Inc Cl B (NKE) - Greater China EBIT is at a current level of 467.00M, up from 191.00M last quarter and up from 421.00M one year ago. This is a change of 144.5% from last quarter and 10.93% from one year ago. |
|
Nike Inc Cl B Greater China EBIT represents the earnings generated from its operations within Mainland China, Hong Kong, Taiwan, and Macau. |
| Report | Fiscal.ai |
| Category | Segments & KPIs |
| Region | United States |
| Source | Fiscal.ai |
|
Data provided via Fiscal.ai |
Stats
| Last Value | 467.00M |
| Latest Period | Feb 2026 |
| Last Updated | Apr 15 2026, 08:34 EDT |
| Next Release | Jul 15 2026, 08:30 EDT (E) |
| Average Growth Rate | 22.04% |
| Value from Last Quarter | 191.00M |
| Change from Last Quarter | 144.5% |
| Value from 1 Year Ago | 421.00M |
| Change from 1 Year Ago | 10.93% |
| Frequency | Quarterly |
| Unit | USD |
| Adjustment | N/A |
| Download Source File |
Related Securities
Related Indicators
| Nike Inc Cl B (NKE) - Apparel Revenue | 3.184B USD |
| Nike Inc Cl B (NKE) - Asia Pacific and Latin America EBIT | 332.00M USD |
| Nike Inc Cl B (NKE) - Asia Pacific and Latin America Revenue | 1.49B USD |
| Nike Inc Cl B (NKE) - Converse EBIT | -40.00M USD |
| Nike Inc Cl B (NKE) - Converse Revenue | 264.00M USD |
| Nike Inc Cl B (NKE) - Equipment Revenue | 468.00M USD |
| Nike Inc Cl B (NKE) - Europe, Middle East & Africa EBIT | 515.00M USD |
| Nike Inc Cl B (NKE) - Europe, Middle East & Africa Revenue | 2.874B USD |
| Nike Inc Cl B (NKE) - Footwear Revenue | 7.353B USD |
| Nike Inc Cl B (NKE) - Global Brand Divisions EBIT | -1.209B USD |
| Nike Inc Cl B (NKE) - Global Brand Divisions Revenue | 7.00M USD |
| Nike Inc Cl B (NKE) - Greater China Revenue | 1.615B USD |
| Nike Inc Cl B (NKE) - North America EBIT | 981.00M USD |
| Nike Inc Cl B (NKE) - North America Revenue | 5.026B USD |