

Nike Inc Cl B (NKE) - Converse EBIT (I:NICBE6N9)
Level Chart
Basic Info
|
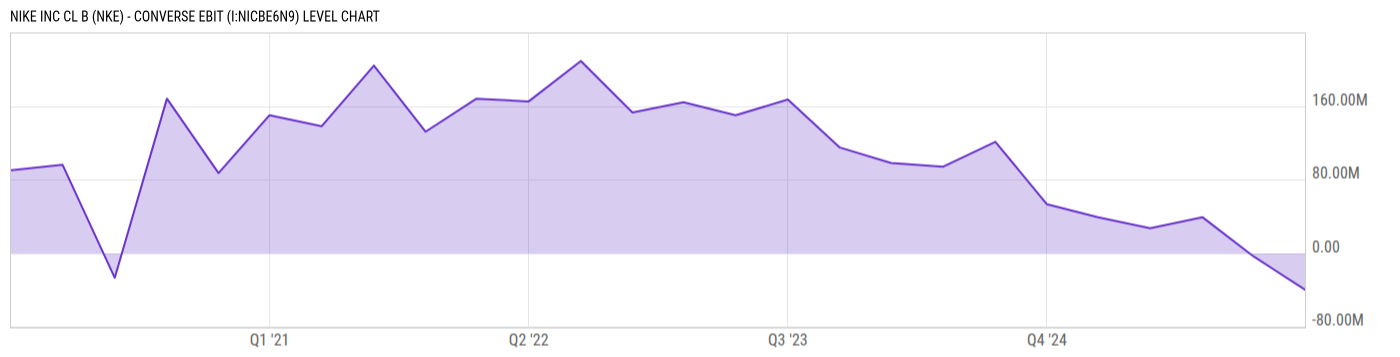
Nike Inc Cl B (NKE) - Converse EBIT is at a current level of -40.00M, down from -4.000M last quarter and down from 39.00M one year ago. This is a change of N/A from last quarter. |
|
Nike Inc Cl B Converse EBIT represents the earnings generated from the company's operations, excluding interest expenses and taxes, and reflects Converse's ability to generate income from its core operations. |
| Report | Fiscal.ai |
| Category | Segments & KPIs |
| Region | United States |
| Source | Fiscal.ai |
|
Data provided via Fiscal.ai |
Stats
| Last Value | -40.00M |
| Latest Period | Feb 2026 |
| Last Updated | Apr 15 2026, 08:34 EDT |
| Next Release | Jul 15 2026, 08:30 EDT (E) |
| Average Growth Rate | -12.81% |
| Value from Last Quarter | -4.00M |
| Change from Last Quarter | N/A |
| Value from 1 Year Ago | 39.00M |
| Change from 1 Year Ago | N/A |
| Frequency | Quarterly |
| Unit | USD |
| Adjustment | N/A |
| Download Source File |
Historical Data
| Date | Value |
|---|---|
| February 28, 2026 | -40.00M |
| November 30, 2025 | -4.00M |
| August 31, 2025 | 39.00M |
| May 31, 2025 | 27.00M |
| February 28, 2025 | 39.00M |
| November 30, 2024 | 53.00M |
| August 31, 2024 | 121.00M |
| May 31, 2024 | 94.00M |
| February 29, 2024 | 98.00M |
| November 30, 2023 | 115.00M |
| August 31, 2023 | 167.00M |
| May 31, 2023 | 150.00M |
| February 28, 2023 | 164.00M |
| Date | Value |
|---|---|
| November 30, 2022 | 153.00M |
| August 31, 2022 | 209.00M |
| May 31, 2022 | 165.00M |
| February 28, 2022 | 168.00M |
| November 30, 2021 | 132.00M |
| August 31, 2021 | 204.00M |
| May 31, 2021 | 138.00M |
| February 28, 2021 | 150.00M |
| November 30, 2020 | 87.00M |
| August 31, 2020 | 168.00M |
| May 31, 2020 | -27.00M |
| February 29, 2020 | 96.00M |
| November 30, 2019 | 90.00M |
News
Basic Info
|
Nike Inc Cl B (NKE) - Converse EBIT is at a current level of -40.00M, down from -4.000M last quarter and down from 39.00M one year ago. This is a change of N/A from last quarter. |
|
Nike Inc Cl B Converse EBIT represents the earnings generated from the company's operations, excluding interest expenses and taxes, and reflects Converse's ability to generate income from its core operations. |
| Report | Fiscal.ai |
| Category | Segments & KPIs |
| Region | United States |
| Source | Fiscal.ai |
|
Data provided via Fiscal.ai |
Stats
| Last Value | -40.00M |
| Latest Period | Feb 2026 |
| Last Updated | Apr 15 2026, 08:34 EDT |
| Next Release | Jul 15 2026, 08:30 EDT (E) |
| Average Growth Rate | -12.81% |
| Value from Last Quarter | -4.00M |
| Change from Last Quarter | N/A |
| Value from 1 Year Ago | 39.00M |
| Change from 1 Year Ago | N/A |
| Frequency | Quarterly |
| Unit | USD |
| Adjustment | N/A |
| Download Source File |
Related Securities
Related Indicators
| Nike Inc Cl B (NKE) - Apparel Revenue | 3.184B USD |
| Nike Inc Cl B (NKE) - Asia Pacific and Latin America EBIT | 332.00M USD |
| Nike Inc Cl B (NKE) - Asia Pacific and Latin America Revenue | 1.49B USD |
| Nike Inc Cl B (NKE) - Converse Revenue | 264.00M USD |
| Nike Inc Cl B (NKE) - Equipment Revenue | 468.00M USD |
| Nike Inc Cl B (NKE) - Europe, Middle East & Africa EBIT | 515.00M USD |
| Nike Inc Cl B (NKE) - Europe, Middle East & Africa Revenue | 2.874B USD |
| Nike Inc Cl B (NKE) - Footwear Revenue | 7.353B USD |
| Nike Inc Cl B (NKE) - Global Brand Divisions EBIT | -1.209B USD |
| Nike Inc Cl B (NKE) - Global Brand Divisions Revenue | 7.00M USD |
| Nike Inc Cl B (NKE) - Greater China EBIT | 467.00M USD |
| Nike Inc Cl B (NKE) - Greater China Revenue | 1.615B USD |
| Nike Inc Cl B (NKE) - North America EBIT | 981.00M USD |
| Nike Inc Cl B (NKE) - North America Revenue | 5.026B USD |