

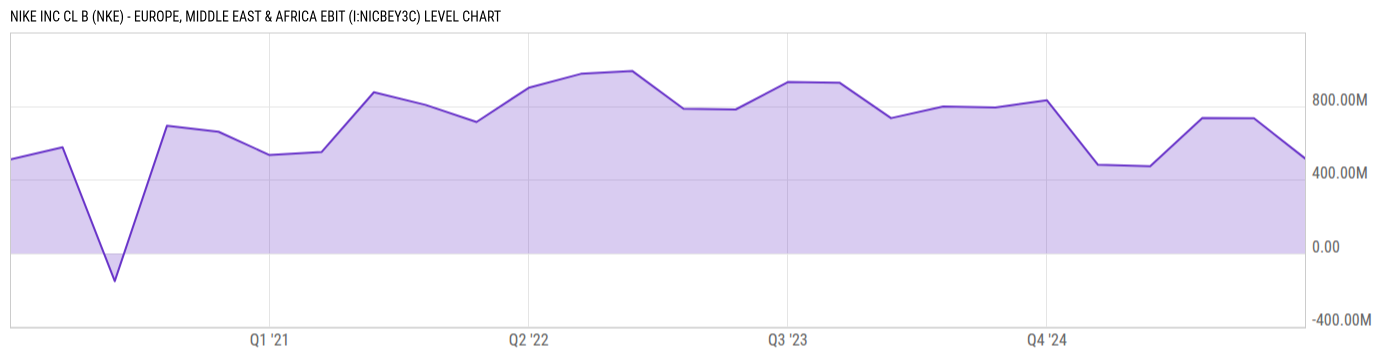
Nike Inc Cl B (NKE) - Europe, Middle East & Africa EBIT (I:NICBEY3C)
Level Chart
Basic Info
|
Nike Inc Cl B (NKE) - Europe, Middle East & Africa EBIT is at a current level of 515.00M, down from 733.00M last quarter and up from 480.00M one year ago. This is a change of -29.74% from last quarter and 7.29% from one year ago. |
|
Nike Inc Cl B Europe, Middle East & Africa EBIT represents the earnings generated from its operations within the European, Middle Eastern, and African markets. |
| Report | Fiscal.ai |
| Category | Segments & KPIs |
| Region | United States |
| Source | Fiscal.ai |
|
Data provided via Fiscal.ai |
Stats
| Last Value | 515.00M |
| Latest Period | Feb 2026 |
| Last Updated | Apr 15 2026, 08:34 EDT |
| Next Release | Jul 15 2026, 08:30 EDT (E) |
| Average Growth Rate | -102.3% |
| Value from Last Quarter | 733.00M |
| Change from Last Quarter | -29.74% |
| Value from 1 Year Ago | 480.00M |
| Change from 1 Year Ago | 7.29% |
| Frequency | Quarterly |
| Unit | USD |
| Adjustment | N/A |
| Download Source File |
Historical Data
| Date | Value |
|---|---|
| February 28, 2026 | 515.00M |
| November 30, 2025 | 733.00M |
| August 31, 2025 | 735.00M |
| May 31, 2025 | 472.00M |
| February 28, 2025 | 480.00M |
| November 30, 2024 | 831.00M |
| August 31, 2024 | 792.00M |
| May 31, 2024 | 797.00M |
| February 29, 2024 | 734.00M |
| November 30, 2023 | 927.00M |
| August 31, 2023 | 930.00M |
| May 31, 2023 | 781.00M |
| February 28, 2023 | 785.00M |
| Date | Value |
|---|---|
| November 30, 2022 | 990.00M |
| August 31, 2022 | 975.00M |
| May 31, 2022 | 899.00M |
| February 28, 2022 | 713.00M |
| November 30, 2021 | 806.00M |
| August 31, 2021 | 875.00M |
| May 31, 2021 | 550.00M |
| February 28, 2021 | 533.00M |
| November 30, 2020 | 660.00M |
| August 31, 2020 | 692.00M |
| May 31, 2020 | -153.00M |
| February 29, 2020 | 575.00M |
| November 30, 2019 | 510.00M |
News
Basic Info
|
Nike Inc Cl B (NKE) - Europe, Middle East & Africa EBIT is at a current level of 515.00M, down from 733.00M last quarter and up from 480.00M one year ago. This is a change of -29.74% from last quarter and 7.29% from one year ago. |
|
Nike Inc Cl B Europe, Middle East & Africa EBIT represents the earnings generated from its operations within the European, Middle Eastern, and African markets. |
| Report | Fiscal.ai |
| Category | Segments & KPIs |
| Region | United States |
| Source | Fiscal.ai |
|
Data provided via Fiscal.ai |
Stats
| Last Value | 515.00M |
| Latest Period | Feb 2026 |
| Last Updated | Apr 15 2026, 08:34 EDT |
| Next Release | Jul 15 2026, 08:30 EDT (E) |
| Average Growth Rate | -102.3% |
| Value from Last Quarter | 733.00M |
| Change from Last Quarter | -29.74% |
| Value from 1 Year Ago | 480.00M |
| Change from 1 Year Ago | 7.29% |
| Frequency | Quarterly |
| Unit | USD |
| Adjustment | N/A |
| Download Source File |
Related Securities
Related Indicators
| Nike Inc Cl B (NKE) - Apparel Revenue | 3.184B USD |
| Nike Inc Cl B (NKE) - Asia Pacific and Latin America EBIT | 332.00M USD |
| Nike Inc Cl B (NKE) - Asia Pacific and Latin America Revenue | 1.49B USD |
| Nike Inc Cl B (NKE) - Converse EBIT | -40.00M USD |
| Nike Inc Cl B (NKE) - Converse Revenue | 264.00M USD |
| Nike Inc Cl B (NKE) - Equipment Revenue | 468.00M USD |
| Nike Inc Cl B (NKE) - Europe, Middle East & Africa Revenue | 2.874B USD |
| Nike Inc Cl B (NKE) - Footwear Revenue | 7.353B USD |
| Nike Inc Cl B (NKE) - Global Brand Divisions EBIT | -1.209B USD |
| Nike Inc Cl B (NKE) - Global Brand Divisions Revenue | 7.00M USD |
| Nike Inc Cl B (NKE) - Greater China EBIT | 467.00M USD |
| Nike Inc Cl B (NKE) - Greater China Revenue | 1.615B USD |
| Nike Inc Cl B (NKE) - North America EBIT | 981.00M USD |
| Nike Inc Cl B (NKE) - North America Revenue | 5.026B USD |