

Nike Inc Cl B (NKE) - Converse Revenue (I:NICBNKEC)
Level Chart
Basic Info
|
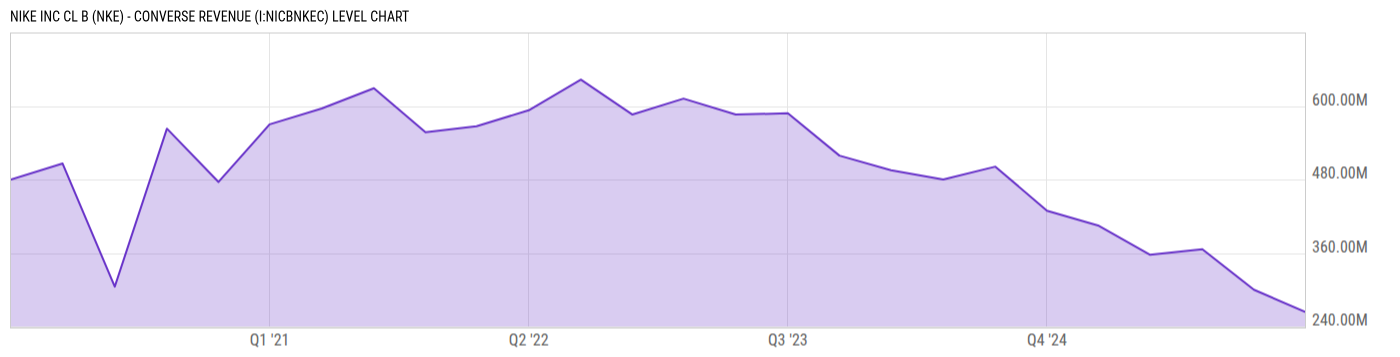
Nike Inc Cl B (NKE) - Converse Revenue is at a current level of 264.00M, down from 300.00M last quarter and down from 405.00M one year ago. This is a change of -12.00% from last quarter and -34.81% from one year ago. |
|
Nike Inc Cl B Converse Revenue refers to the revenue generated from Converse products, including classic Chuck Taylor All Star shoes, Chuck 70 shoes, various lifestyle sneakers, apparel (such as T-shirts, hoodies, and jackets), and accessories like bags, hats, and socks. |
| Report | Fiscal.ai |
| Category | Segments & KPIs |
| Region | United States |
| Source | Fiscal.ai |
|
Data provided via Fiscal.ai |
Stats
| Last Value | 264.00M |
| Latest Period | Feb 2026 |
| Last Updated | Apr 15 2026, 08:34 EDT |
| Next Release | Jul 15 2026, 08:30 EDT (E) |
| Average Growth Rate | -2.34% |
| Value from Last Quarter | 300.00M |
| Change from Last Quarter | -12.00% |
| Value from 1 Year Ago | 405.00M |
| Change from 1 Year Ago | -34.81% |
| Frequency | Quarterly |
| Unit | USD |
| Adjustment | N/A |
| Download Source File |
Historical Data
| Date | Value |
|---|---|
| February 28, 2026 | 264.00M |
| November 30, 2025 | 300.00M |
| August 31, 2025 | 366.00M |
| May 31, 2025 | 357.00M |
| February 28, 2025 | 405.00M |
| November 30, 2024 | 429.00M |
| August 31, 2024 | 501.00M |
| May 31, 2024 | 480.00M |
| February 29, 2024 | 495.00M |
| November 30, 2023 | 519.00M |
| August 31, 2023 | 588.00M |
| May 31, 2023 | 586.00M |
| February 28, 2023 | 612.00M |
| Date | Value |
|---|---|
| November 30, 2022 | 586.00M |
| August 31, 2022 | 643.00M |
| May 31, 2022 | 593.00M |
| February 28, 2022 | 567.00M |
| November 30, 2021 | 557.00M |
| August 31, 2021 | 629.00M |
| May 31, 2021 | 596.00M |
| February 28, 2021 | 570.00M |
| November 30, 2020 | 476.00M |
| August 31, 2020 | 563.00M |
| May 31, 2020 | 305.00M |
| February 29, 2020 | 506.00M |
| November 30, 2019 | 480.00M |
News
Basic Info
|
Nike Inc Cl B (NKE) - Converse Revenue is at a current level of 264.00M, down from 300.00M last quarter and down from 405.00M one year ago. This is a change of -12.00% from last quarter and -34.81% from one year ago. |
|
Nike Inc Cl B Converse Revenue refers to the revenue generated from Converse products, including classic Chuck Taylor All Star shoes, Chuck 70 shoes, various lifestyle sneakers, apparel (such as T-shirts, hoodies, and jackets), and accessories like bags, hats, and socks. |
| Report | Fiscal.ai |
| Category | Segments & KPIs |
| Region | United States |
| Source | Fiscal.ai |
|
Data provided via Fiscal.ai |
Stats
| Last Value | 264.00M |
| Latest Period | Feb 2026 |
| Last Updated | Apr 15 2026, 08:34 EDT |
| Next Release | Jul 15 2026, 08:30 EDT (E) |
| Average Growth Rate | -2.34% |
| Value from Last Quarter | 300.00M |
| Change from Last Quarter | -12.00% |
| Value from 1 Year Ago | 405.00M |
| Change from 1 Year Ago | -34.81% |
| Frequency | Quarterly |
| Unit | USD |
| Adjustment | N/A |
| Download Source File |
Related Securities
Related Indicators
| Nike Inc Cl B (NKE) - Apparel Revenue | 3.184B USD |
| Nike Inc Cl B (NKE) - Asia Pacific and Latin America EBIT | 332.00M USD |
| Nike Inc Cl B (NKE) - Asia Pacific and Latin America Revenue | 1.49B USD |
| Nike Inc Cl B (NKE) - Converse EBIT | -40.00M USD |
| Nike Inc Cl B (NKE) - Equipment Revenue | 468.00M USD |
| Nike Inc Cl B (NKE) - Europe, Middle East & Africa EBIT | 515.00M USD |
| Nike Inc Cl B (NKE) - Europe, Middle East & Africa Revenue | 2.874B USD |
| Nike Inc Cl B (NKE) - Footwear Revenue | 7.353B USD |
| Nike Inc Cl B (NKE) - Global Brand Divisions EBIT | -1.209B USD |
| Nike Inc Cl B (NKE) - Global Brand Divisions Revenue | 7.00M USD |
| Nike Inc Cl B (NKE) - Greater China EBIT | 467.00M USD |
| Nike Inc Cl B (NKE) - Greater China Revenue | 1.615B USD |
| Nike Inc Cl B (NKE) - North America EBIT | 981.00M USD |
| Nike Inc Cl B (NKE) - North America Revenue | 5.026B USD |