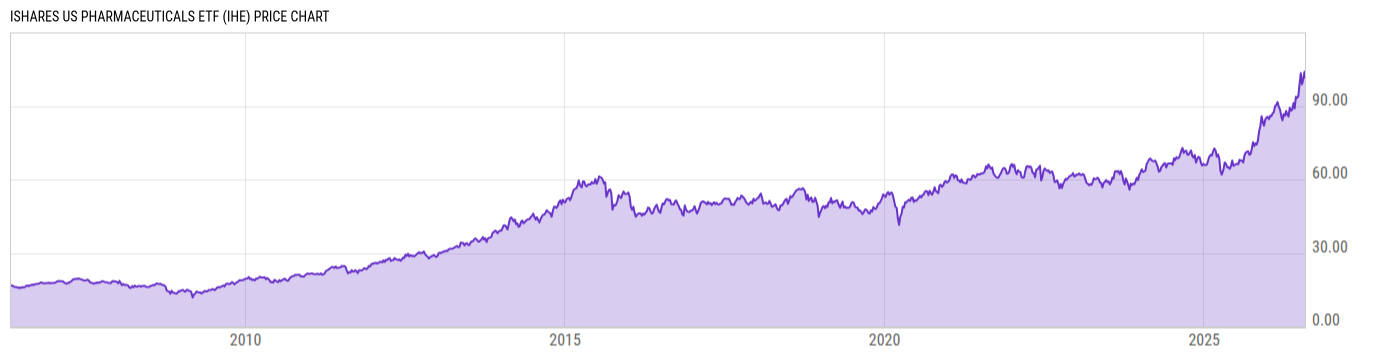
iShares US Pharmaceuticals ETF (IHE)
171.42
+1.48
(+0.87%)
USD |
NYSEARCA |
Mar 24, 16:00
170.19
-1.23
(-0.72%)
Pre-Market: 20:00
Key Stats
Expense Ratio | Discount or Premium to NAV | Total Assets Under Management | 30-Day Average Daily Volume |
---|---|---|---|
0.39% | -0.14% | 369.08M | 7699.93 |
Dividend Yield | Turnover Ratio | 1 Year Fund Level Flows | Max Drawdown (All) |
2.11% | 20.00% | 32.34M | Upgrade |
Basic Info
Investment Strategy | |
The investment seeks to track the investment results of the Dow Jones U.S. Select Pharmaceuticals Index. The fund generally will invest at least 80% of its assets in the component securities of its underlying index and in investments that have economic characteristics that are substantially identical to the component securities of its underlying index. The underlying index measures the performance of the pharmaceuticals sector of the U.S. equity market. The underlying index includes pharmaceutical companies such as manufacturers of prescription or over-the-counter drugs or vaccines. The fund is non-diversified. |
General | |
Security Type | Exchange-Traded Fund |
Equity Style | Large Cap/Value |
Fixed Income Style | -- |
Broad Asset Class | Sector Equity |
Broad Category | Equity |
Category Name | Health |
Category Index | S&P 1500 Health Care TR |
Global Category Name | Healthcare Sector Equity |
YCharts Categorization | Healthcare Equity |
YCharts Benchmark | S&P 1500 Health Care (Sector) Total Return (^SP15HCSTR) |
Prospectus Objective | Specialty - Health |
Fund Owner Firm Name | iShares |
Prospectus Benchmark Index | |
DJ US Select Pharms TR USD | 100.0% |
Broad Asset Class Benchmark Index | |
^MSWNTR | 100.0% |
Manager Tenure | |
Greg Savage | 15.17 yrs |
Jennifer Hsui | 10.50 yrs |
Paul Whitehead | 1.16 yrs |
Net Fund Flows Versus Category
1 Month
% Rank:
--
--
Category Low
--
Category High
1 Year
% Rank:
12
32.34M
-2.719B
Category Low
6.230B
Category High
3 Months
% Rank:
--
--
Category Low
--
Category High
3 Years
% Rank:
--
--
Category Low
--
Category High
6 Months
% Rank:
--
--
Category Low
--
Category High
5 Years
% Rank:
--
--
Category Low
--
Category High
YTD
% Rank:
--
--
Category Low
--
Category High
10 Years
% Rank:
--
--
Category Low
--
Category High
As of February 28, 2023
Risk
Performance Versus Category
As of March 24, 2023. Returns for periods of 1 year and above are annualized.
Annual Total Returns Versus Peers
As of March 24, 2023.
Asset Allocation
Top 10 Holdings
Name | % Weight | Price | % Change |
---|---|---|---|
Johnson & Johnson | 22.87% | 152.65 | 1.01% |
Merck & Co Inc | 19.68% | 104.80 | 0.55% |
Eli Lilly and Co | 4.90% | 336.13 | 1.05% |
Royalty Pharma PLC Class A | 4.70% | 35.43 | 1.81% |
Bristol-Myers Squibb Co | 4.63% | 67.68 | 1.05% |
Pfizer Inc | 4.62% | 40.39 | 0.52% |
Zoetis Inc Class A | 4.43% | 164.18 | 1.82% |
Catalent Inc | 4.29% | 64.27 | 2.60% |
Viatris Inc | 4.12% | 9.33 | 1.41% |
Jazz Pharmaceuticals PLC | 3.51% | 141.28 | 2.79% |
News
Headline
Wire
Time (ET)
SA Breaking News
04/30 16:00
SA Breaking News
07/08 15:38
SA Breaking News
06/10 13:47
SA Breaking News
03/14 00:40
Basic Info
Investment Strategy | |
The investment seeks to track the investment results of the Dow Jones U.S. Select Pharmaceuticals Index. The fund generally will invest at least 80% of its assets in the component securities of its underlying index and in investments that have economic characteristics that are substantially identical to the component securities of its underlying index. The underlying index measures the performance of the pharmaceuticals sector of the U.S. equity market. The underlying index includes pharmaceutical companies such as manufacturers of prescription or over-the-counter drugs or vaccines. The fund is non-diversified. |
General | |
Security Type | Exchange-Traded Fund |
Equity Style | Large Cap/Value |
Fixed Income Style | -- |
Broad Asset Class | Sector Equity |
Broad Category | Equity |
Category Name | Health |
Category Index | S&P 1500 Health Care TR |
Global Category Name | Healthcare Sector Equity |
YCharts Categorization | Healthcare Equity |
YCharts Benchmark | S&P 1500 Health Care (Sector) Total Return (^SP15HCSTR) |
Prospectus Objective | Specialty - Health |
Fund Owner Firm Name | iShares |
Prospectus Benchmark Index | |
DJ US Select Pharms TR USD | 100.0% |
Broad Asset Class Benchmark Index | |
^MSWNTR | 100.0% |
Manager Tenure | |
Greg Savage | 15.17 yrs |
Jennifer Hsui | 10.50 yrs |
Paul Whitehead | 1.16 yrs |
Fundamentals
General | |
Distribution Yield | Upgrade |
Dividend Yield TTM (3-24-23) | 2.11% |
30-Day SEC Yield (2-28-23) | Upgrade |
7-Day SEC Yield | -- |
Number of Holdings | Upgrade |
Stock | |
Weighted Average PE Ratio | 17.66 |
Weighted Average Price to Sales Ratio | Upgrade |
Weighted Average Price to Book Ratio | Upgrade |
Weighted Median ROE | Upgrade |
Weighted Median ROA | Upgrade |
Forecasted Dividend Yield | Upgrade |
Forecasted PE Ratio | Upgrade |
Forecasted Price to Sales Ratio | Upgrade |
Forecasted Price to Book Ratio | Upgrade |
As of March 22, 2023
Fund Details
Key Dates | |
Inception Date | 5/1/2006 |
Last Annual Report Date | 3/31/2022 |
Last Prospectus Date | 8/1/2022 |
Attributes | |
Index Fund |
|
Inverse Fund | No |
Leveraged Fund | No |
Fund of Funds | No |
Currency Hedged Fund | No |
Synthetic Replication Fund | No |
Has Dividend Investment Plan | No |
Socially Responsible Fund | No |
News
Headline
Wire
Time (ET)
SA Breaking News
04/30 16:00
SA Breaking News
07/08 15:38
SA Breaking News
06/10 13:47
SA Breaking News
03/14 00:40