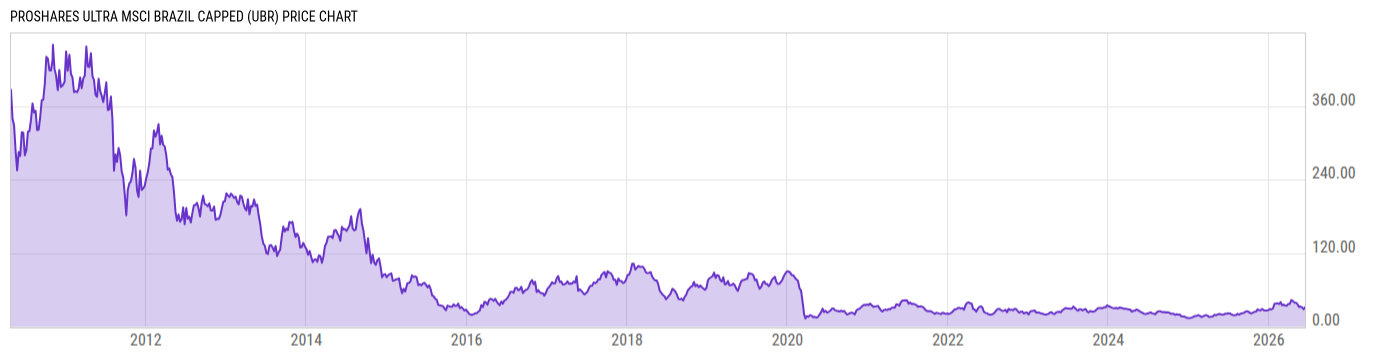
ProShares Ultra MSCI Brazil Capped (UBR)
76.50
+1.78 +2.38%
NYSE Arca
Dec 5, 14:29
Delayed 2m
USD
Key Stats
Expense Ratio | 0.95% |
Total Assets Under Management | 6.836M |
Share Class Assets Under Management | 6.836M |
30-Day Average Daily Volume | 2015.97 |
Net Asset Value | 74.66 |
Discount or Premium to NAV | 0.08% |
Turnover Ratio | -- |
1 Year Fund Level Flows | -1.975M |
View All UBR News
News
-
WireHeadlineTime (ET)
-
SA Breaking News12/03 10:30
-
SA Breaking News06/17 03:14
-
SA Breaking News04/12 15:59
-
SA Breaking News03/21 11:57
-
SA Breaking News03/20 05:52
-
SA Breaking News03/18 17:08
-
SA Breaking News03/12 11:20
-
SA Breaking News02/13 15:53
-
SA Breaking News02/06 15:53
-
SA Breaking News01/02 12:26
Performance & Returns
Total Return (Price) | Total Return (NAV) | Cat. Total Return (NAV) | % Rank in Cat. (NAV) | |
---|---|---|---|---|
1M | -6.74% | -6.79% | -- | -- |
3M | 9.72% | 9.62% | -- | -- |
6M | 2.15% | 1.79% | -- | -- |
YTD | 19.15% | 18.65% | -- | -- |
1Y | 14.72% | 14.72% | -- | -- |
3Y | 13.64% | 13.77% | -- | -- |
5Y | -4.99% | -4.97% | -- | -- |
10Y | -- | -- | -- | -- |
15Y | -- | -- | -- | -- |
20Y | -- | -- | -- | -- |
Asset Allocation
Type | % Net | % Long | % Short |
---|---|---|---|
Cash | -99.96% | 100.0% | 200.0% |
Stock | 200.0% | 200.0% | 0.00% |
Bond | 0.00% | 0.00% | 0.00% |
Convertible | 0.00% | 0.00% | 0.00% |
Preferred | 0.00% | 0.00% | 0.00% |
Other | 0.00% | 0.00% | 0.00% |
Region Exposure
Americas | -- |
North America | -- |
Latin America | -- |
Greater Europe | -- |
United Kingdom | -- |
Europe Developed | -- |
Europe Emerging | -- |
Africa/Middle East | -- |
Greater Asia | -- |
Japan | -- |
Australasia | -- |
Asia Developed | -- |
Asia Emerging | -- |
Market Classification | |
% Developed Markets | -- |
% Emerging Markets | -- |
Stock Sector Exposure
Basic Materials | 0.00% |
Communication Services | 0.00% |
Consumer Cyclical | 0.00% |
Consumer Defensive | 0.00% |
Energy | 0.00% |
Financial Services | 0.00% |
Healthcare | 0.00% |
Industrials | 0.00% |
Real Estate | 0.00% |
Technology | 0.00% |
Utilities | 0.00% |
Stock Market Capitalization
Giant | 0.00% |
Large | 0.00% |
Medium | 0.00% |
Small | 0.00% |
Micro | 0.00% |
Stock Style Exposure
Large Cap Value | -- |
Large Cap Blend | -- |
Large Cap Growth | -- |
Mid Cap Value | -- |
Mid Cap Blend | -- |
Mid Cap Growth | -- |
Small Cap Value | -- |
Small Cap Blend | -- |
Small Cap Growth | -- |
View More Holdings
As of Nov. 30, 2019
Top 6 Holdings
Symbol | Name | % Weight | Price | % Chg |
---|---|---|---|---|
-- | Ishares Msci Brazil Capped (Ewz) Swap Credit Suisse International | 71.52% | -- | -- |
-- | Ishares Msci Brazil Capped (Ewz) Swap Societe Generale | 39.82% | -- | -- |
-- | Ishares Msci Brazil Capped (Ewz) Swap Bank Of America Na | 30.19% | -- | -- |
-- | Ishares Msci Brazil Capped (Ewz) Swap Ubs Ag | 30.13% | -- | -- |
-- | Ishares Msci Brazil Capped (Ewz) Swap Citibank Na | 26.65% | -- | -- |
-- | Ishares Msci Brazil Capped (Ewz) Swap Morgan Stanley & Co. International Pl | 1.66% | -- | -- |
Advertisement
Basic Info
Investment Strategy | |
---|---|
The investment seeks daily investment results that correspond to two times (2x) the daily performance of the MSCI Brazil 25/50 Index®. The fund invests in financial instruments that ProShare Advisors believes, in combination, should produce daily returns consistent with the fund's investment objective. The index is designed to measure the performance of the large and mid cap segments of the Brazilian market. It covers approximately 85% of the free float-adjusted market capitalization in Brazil. The fund is non-diversified. | |
General | |
Security Type | Exchange-Traded Fund |
Equity Style | -- |
Fixed Income Style | -- |
Broad Asset Class | Alternative |
Broad Category | Alternative |
Category Name | Trading--Leveraged Equity |
Prospectus Objective | Foreign Stock |
Fund Owner Firm Name | ProShares |
Benchmark Index | |
MSCI Brazil 25-50 GR USD | 200.0% |
Reports | |
One Page Report | Download |
Manager Info
Name | Tenure |
---|---|
Ryan Dofflemeyer | 0.57 yrs |
Scott Hanson | 3.17 yrs |
Net Fund Flows
1M | 0.00 |
3M | 0.00 |
6M | -1.975M |
YTD | -1.975M |
1Y | -1.975M |
3Y | -16.27M |
5Y | -443646.3 |
10Y | -- |
Risk Info
Beta (5Y) | 2.342 |
Max Drawdown (All) | 96.17% |
Historical Sharpe Ratio (10Y) | -- |
Historical Sortino (All) | -0.0504 |
30-Day Rolling Volatility | 41.30% |
Daily Value at Risk (VaR) 1% (All) | 9.36% |
Monthly Value at Risk (VaR) 1% (All) | 33.80% |
Fundamentals
Dividend Yield TTM (12-5-19) | 0% |
30-Day SEC Yield | -- |
7-Day SEC Yield | -- |
Weighted Average PE Ratio | -- |
Weighted Average Price to Sales Ratio | -- |
Weighted Average Price to Book Ratio | -- |
Weighted Median ROE | -- |
Weighted Median ROA | -- |
Forecasted Dividend Yield | -- |
Forecasted PE Ratio | -- |
Forecasted Price to Sales Ratio | -- |
Forecasted Price to Book Ratio | -- |
Number of Holdings | 13 |
Growth Estimates
Forecasted 5 Yr Earnings Growth | -- |
Forecasted Book Value Growth | -- |
Forecasted Cash Flow Growth | -- |
Forecasted Earnings Growth | -- |
Forecasted Revenue Growth | -- |
Attributes
Key Dates | |
---|---|
Inception Date | 4/27/2010 |
Termination Date | |
Last Annual Report Date | 5/31/2019 |
Last Prospectus Date | 10/1/2019 |
Attributes | |
Exchange Traded Share | Yes |
Exchange Traded Note | No |
Enhanced Index Fund | No |
Fixed Distribution Fund | No |
High-Net Worth Individual Fund | No |
Index Fund | Yes |
Inverse Fund | No |
Leveraged Fund | Yes |
Fund of Funds | No |
Currency Hedged Fund | No |
Synthetic Replication Fund | No |
Has Dividend Investment Plan | No |
Socially Responsible Fund | No |
General Availability | |
Available for Insurance Product | No |
Available for Retirement Plan | No |
Available for RRSP | No |
Advertisement