

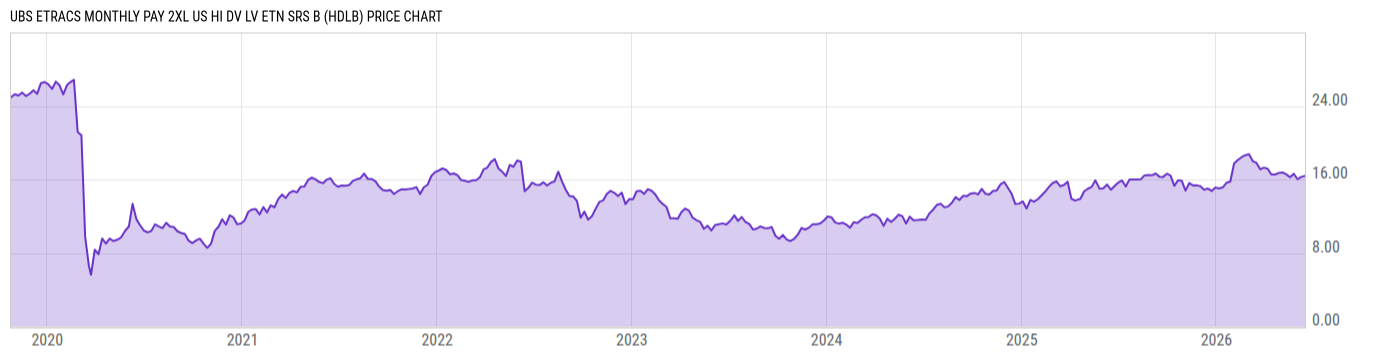
UBS ETRACS Monthly Pay 2xL US Hi Dv LV ETN Srs B (HDLB)
15.81
+0.12
(+0.76%)
USD |
NYSEARCA |
Jun 08, 16:00
Price Chart
Key Stats
| Net Expense Ratio | Discount or Premium to NAV | Total Assets Under Management | 30-Day Average Daily Volume |
|---|---|---|---|
| 0.85% | 0.10% | 5.053M | 3097.20 |
| Weighted Average Dividend Yield | Turnover Ratio (Generic) | 1 Year Fund Level Flows | Max Drawdown (Since Inception) |
| -- | -- | -5.061M |
Basic Info
| Investment Strategy | |
| The Fund seeks return on Securities linked to the performance of price return version of Solactive US High Dividend Low Volatility Index. The Index is designed to measure the performance of 40 dividend yielding, relatively lower volatility Index Constituent Securities from the universe of largest 1,000 US listed stocks. |
| General | |
| Security Type | Exchange-Traded Fund |
| Equity Style | -- |
| Broad Asset Class | Miscellaneous |
| Broad Category | Alternative Strategies |
| Global Peer Group | Alternative Equity Leveraged |
| Peer Group | Equity Leverage Funds |
| Global Macro | Alternative Equity |
| US Macro | Large-Cap Funds |
| YCharts Categorization | -- |
| YCharts Benchmark | -- |
| Prospectus Objective | Equity Leverage Funds |
| Fund Owner Firm Name | UBS Asset Management |
| Broad Asset Class Benchmark Index | |
| ^SPXTR | 100.0% |
Performance Versus Peer Group
Annual Total Returns Versus Peers
As of June 09, 2026.
Asset Allocation
| Type | % Net |
|---|
Basic Info
| Investment Strategy | |
| The Fund seeks return on Securities linked to the performance of price return version of Solactive US High Dividend Low Volatility Index. The Index is designed to measure the performance of 40 dividend yielding, relatively lower volatility Index Constituent Securities from the universe of largest 1,000 US listed stocks. |
| General | |
| Security Type | Exchange-Traded Fund |
| Equity Style | -- |
| Broad Asset Class | Miscellaneous |
| Broad Category | Alternative Strategies |
| Global Peer Group | Alternative Equity Leveraged |
| Peer Group | Equity Leverage Funds |
| Global Macro | Alternative Equity |
| US Macro | Large-Cap Funds |
| YCharts Categorization | -- |
| YCharts Benchmark | -- |
| Prospectus Objective | Equity Leverage Funds |
| Fund Owner Firm Name | UBS Asset Management |
| Broad Asset Class Benchmark Index | |
| ^SPXTR | 100.0% |