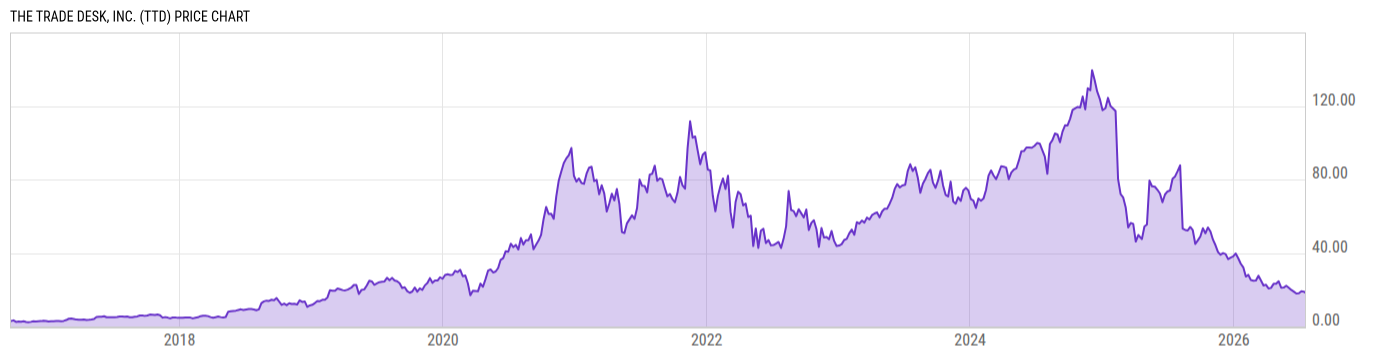
The Trade Desk Inc (TTD)
60.45
+0.26
(+0.43%)
USD |
NASDAQ |
Mar 24, 16:00
60.44
-0.01
(-0.02%)
After-Hours: 20:00
Key Stats
Price and Performance | |
---|---|
Market Cap | 29.67B |
52 Week High (Daily) | Upgrade |
52 Week Low (Daily) | Upgrade |
All-Time High (Daily) | Upgrade |
Year to Date Total Returns (Daily) | Upgrade |
1 Month Total Returns (Daily) | Upgrade |
1 Year Total Returns (Daily) | -11.62% |
Valuation | |
PE Ratio | 604.50 |
PE Ratio (Forward) | Upgrade |
PS Ratio | 19.27 |
Price to Book Value | 14.03 |
EV to EBITDA | Upgrade |
Dividend | |
---|---|
Dividend | -- |
Dividend Yield (Forward) | Upgrade |
Financials | |
Revenue (5 Year Growth) | Upgrade |
Revenue (Quarterly YoY Growth) | Upgrade |
EPS Diluted (5 Year Growth) | Upgrade |
EPS Diluted (Quarterly YoY Growth) | Upgrade |
Debt to Equity Ratio | 0.00 |
Return on Equity | Upgrade |
Return on Assets | Upgrade |
Risk | |
Beta (5Y) | Upgrade |
Max Drawdown (5Y) | 64.27% |
News
Headline
Wire
Time (ET)
Yahoo
03/24 07:30
Events
DATE | TIME | TYPE | PERIOD | REPORTED EPS |
ESTIMATED EPS |
SURPRISE | |
05/10/2023* | 14:00 EST | Earnings Call | Q1 2023 | -- | -- | -- | |
05/10/2023* | -- | Results | Q1 2023 | -- | 0.12 | -- | |
02/15/2023 | 08:00 EST | Earnings Call | Q4 2022 | -- | -- | -- | |
02/15/2023 | -- | Results | Q4 2022 | 0.38 | 0.36 | 5.95% | |
11/09/2022 | 08:00 EST | Earnings Call | Q3 2022 | -- | -- | -- | |
11/09/2022 | -- | Results | Q3 2022 | 0.26 | 0.23 | 15.22% | |
08/09/2022 | 17:00 EST | Earnings Call | Q2 2022 | -- | -- | -- | |
08/09/2022 | -- | Results | Q2 2022 | 0.20 | 0.20 | 0.39% |
*Estimated Date/Time
Earnings
Profile
Edit
The Trade Desk provides a self-service platform that helps advertisers and ad agencies programmatically find and purchase digital ad inventory (display, video, audio, native, and social) on different devices like computers, smartphones, digital out of home, and connected TVs. It utilizes data to optimize the performance of ad impressions purchased. The firm’s platform is referred to as a demand-side platform in the digital ad industry. The firm generates its revenue from fees based on a percentage of what its clients spend on advertising. The Trade Desk became a public company in 2016 and has since increased revenue at a 43% average annual rate. During that period, it has been profitable with operating margins of 10%-28%. |
URL | https://www.thetradedesk.com |
Investor Relations URL | https://investors.thetradedesk.com/ |
HQ State/Province | California |
Sector | Technology |
Industry | Software - Application |
Equity Style | Mid Cap/Growth |
Next Earnings Release | May. 10, 2023 (est.) |
Last Earnings Release | Feb. 15, 2023 |
Next Ex-Dividend Date | N/A |
Last Ex-Dividend Date | N/A |
Analyst Coverage
Consensus Rating
|
|
Analyst Recommendation
|
Source: S&P Global
Dividends
Dividend Per Share (TTM) | -- |
2017
2018
2019
2020
2021
6.00%
4.00%
2.00%
|
|
Yield to Market | 0.00 |
Yield to Sector | 0.00 |
Yield to Industry | 0.00 |
Last Dividend Amt. | -- |
Dividend Frequency | -- |
Last Ex-Dividend Date | -- |
Yield (TTM) | 0.00% |
Forward Yield | -- |
Payout Ratio | 0.00% |
Cash Payout Ratio | 0.00% |
Consistent Payer (5Y) | No |
Consistent Growth (5Y) | No |
Risk
Total Returns Comparison
Annual Total Returns Versus Peers
As of March 24, 2023.
Fundamentals
Revenue (TTM) | 1.578B |
Total Expenses (TTM) | 1.464B |
Net Income (TTM) | 53.38M |
Total Assets (Quarterly) | 4.381B |
Total Liabilities (Quarterly) | 2.265B |
Shareholders Equity (Quarterly) | 2.115B |
Cash from Operations (TTM) | 548.73M |
Cash from Investing (TTM) | -304.37M |
Cash from Financing (TTM) | 31.99M |
Ratings
Profile
Edit
The Trade Desk provides a self-service platform that helps advertisers and ad agencies programmatically find and purchase digital ad inventory (display, video, audio, native, and social) on different devices like computers, smartphones, digital out of home, and connected TVs. It utilizes data to optimize the performance of ad impressions purchased. The firm’s platform is referred to as a demand-side platform in the digital ad industry. The firm generates its revenue from fees based on a percentage of what its clients spend on advertising. The Trade Desk became a public company in 2016 and has since increased revenue at a 43% average annual rate. During that period, it has been profitable with operating margins of 10%-28%. |
URL | https://www.thetradedesk.com |
Investor Relations URL | https://investors.thetradedesk.com/ |
HQ State/Province | California |
Sector | Technology |
Industry | Software - Application |
Equity Style | Mid Cap/Growth |
Next Earnings Release | May. 10, 2023 (est.) |
Last Earnings Release | Feb. 15, 2023 |
Next Ex-Dividend Date | N/A |
Last Ex-Dividend Date | N/A |
Ownership
Insider Ownership Percentage | Upgrade |
Jul '20
Nov '20
Mar '21
80.00%
40.00%
10.00%
Analyst Coverage
Consensus Rating
|
|
Analyst Recommendation
|
Source: S&P Global
Top Fund Holders
Symbol | Dollars Invested | % Weight |
---|---|---|
TAAEX | 95.93M USD | 6.72% |
MGHRX | 275.96M USD | 5.90% |
MBIRX | 74.71M USD | 5.66% |
PSJ | 9.696M USD | 5.33% |
QQQN | 2.901M USD | 3.06% |
QQQJ | 14.59M USD | 1.99% |
VWUSX | 495.60M USD | 1.46% |
FCOM | 6.592M USD | 1.22% |
VOX | 26.15M USD | 0.96% |
VEXMX | 341.23M USD | 0.39% |
VXF | 341.23M USD | 0.39% |
FSMAX | 115.70M USD | 0.35% |
Other Resources
Whale Wisdom | 13F Filings |
Seeking Alpha | Call Transcripts |
Nasdaq | Insider Trading |
Nasdaq | Institutional Ownership |
Nasdaq | Option Chain |
SEC | SEC Filings |
TTD Tweets |