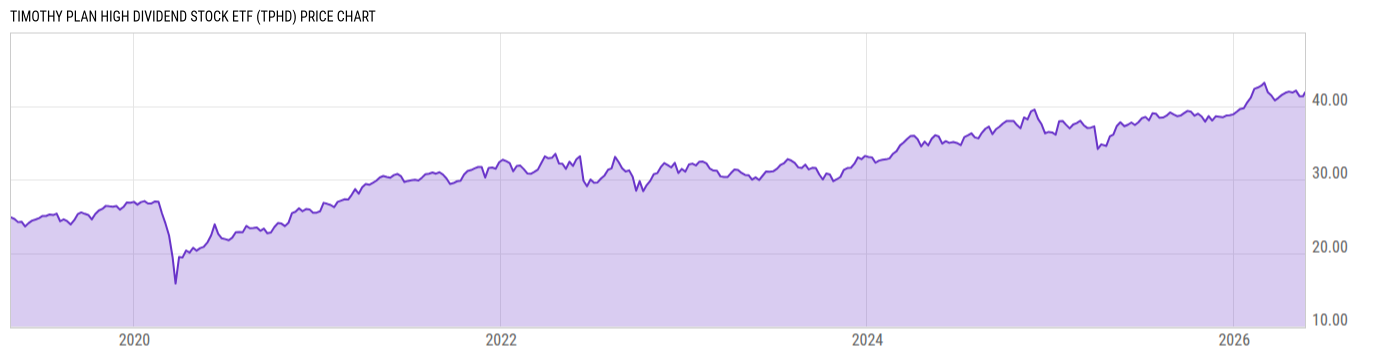
Timothy Plan High Dividend Stock ETF (TPHD)
31.02
+0.23
(+0.74%)
USD |
NYSEARCA |
Mar 30, 16:00
31.02
0.00 (0.00%)
After-Hours: 20:00
Key Stats
Expense Ratio | Discount or Premium to NAV | Total Assets Under Management | 30-Day Average Daily Volume |
---|---|---|---|
0.52% | 0.07% | 184.64M | 32192.57 |
Dividend Yield | Turnover Ratio | 1 Year Fund Level Flows | Max Drawdown (All) |
2.18% | 42.00% | 54.93M | Upgrade |
Basic Info
Investment Strategy | |
The investment seeks to provide investment results that track the performance of the Victory US Large Cap High Dividend Volatility Weighted BRI Index before fees and expenses. The fund seeks to achieve its investment objective by investing, under normal market conditions, at least 80% of its net assets directly or indirectly in the securities included in the Victory US Large Cap High Dividend Volatility Weighted BRI Index, an unmanaged, volatility weighted index created by the Sub-Advisor. The index combines fundamental criteria with individual security risk control achieved through volatility weighting of individual securities. |
General | |
Security Type | Exchange-Traded Fund |
Equity Style | Mid Cap/Value |
Fixed Income Style | -- |
Broad Asset Class | US Equity |
Broad Category | Equity |
Category Name | Mid-Cap Value |
Category Index | Russell Mid Cap Value TR USD |
Global Category Name | US Equity Large Cap Value |
YCharts Categorization | US Large Cap Value |
YCharts Benchmark | Russell 1000 Value Total Return (^RLVTR) |
Prospectus Objective | Equity-Income |
Fund Owner Firm Name | Timothy Plan |
Prospectus Benchmark Index | |
Victory US LC Hgh Div Vol Wgt BRI TR USD | 100.0% |
Broad Asset Class Benchmark Index | |
^SPXTR | 100.0% |
Manager Tenure | |
Free Foutz | 3.84 yrs |
Mannik Dhillon | 3.84 yrs |
Net Fund Flows Versus Category
1 Month
% Rank:
--
--
Category Low
--
Category High
1 Year
% Rank:
20
54.93M
-9.518B
Category Low
10.04B
Category High
3 Months
% Rank:
--
--
Category Low
--
Category High
3 Years
% Rank:
--
--
Category Low
--
Category High
6 Months
% Rank:
--
--
Category Low
--
Category High
5 Years
% Rank:
--
--
Category Low
--
Category High
YTD
% Rank:
--
--
Category Low
--
Category High
10 Years
% Rank:
--
--
Category Low
--
Category High
As of February 28, 2023
Risk
Performance Versus Category
As of March 29, 2023. Returns for periods of 1 year and above are annualized.
Annual Total Returns Versus Peers
As of March 29, 2023.
Asset Allocation
Top 10 Holdings
Name | % Weight | Price | % Change |
---|---|---|---|
Ameren Corp | 1.51% | 86.47 | 0.53% |
Consolidated Edison Inc | 1.49% | 94.72 | -0.40% |
Atmos Energy Corp | 1.46% | 111.97 | 0.39% |
Xcel Energy Inc | 1.44% | 66.91 | 0.56% |
WEC Energy Group Inc | 1.41% | 94.43 | 0.10% |
CMS Energy Corp | 1.39% | 61.22 | 0.08% |
CenterPoint Energy Inc | 1.39% | 29.33 | 0.10% |
Evergy Inc | 1.38% | 60.48 | 0.58% |
DTE Energy Co | 1.38% | 108.71 | 0.71% |
Southern Co | 1.37% | 69.05 | -0.42% |
News
Headline
Wire
Time (ET)
Basic Info
Investment Strategy | |
The investment seeks to provide investment results that track the performance of the Victory US Large Cap High Dividend Volatility Weighted BRI Index before fees and expenses. The fund seeks to achieve its investment objective by investing, under normal market conditions, at least 80% of its net assets directly or indirectly in the securities included in the Victory US Large Cap High Dividend Volatility Weighted BRI Index, an unmanaged, volatility weighted index created by the Sub-Advisor. The index combines fundamental criteria with individual security risk control achieved through volatility weighting of individual securities. |
General | |
Security Type | Exchange-Traded Fund |
Equity Style | Mid Cap/Value |
Fixed Income Style | -- |
Broad Asset Class | US Equity |
Broad Category | Equity |
Category Name | Mid-Cap Value |
Category Index | Russell Mid Cap Value TR USD |
Global Category Name | US Equity Large Cap Value |
YCharts Categorization | US Large Cap Value |
YCharts Benchmark | Russell 1000 Value Total Return (^RLVTR) |
Prospectus Objective | Equity-Income |
Fund Owner Firm Name | Timothy Plan |
Prospectus Benchmark Index | |
Victory US LC Hgh Div Vol Wgt BRI TR USD | 100.0% |
Broad Asset Class Benchmark Index | |
^SPXTR | 100.0% |
Manager Tenure | |
Free Foutz | 3.84 yrs |
Mannik Dhillon | 3.84 yrs |
Fundamentals
General | |
Distribution Yield | Upgrade |
Dividend Yield TTM (3-30-23) | 2.18% |
30-Day SEC Yield (2-28-23) | Upgrade |
7-Day SEC Yield | -- |
Number of Holdings | Upgrade |
Stock | |
Weighted Average PE Ratio | 14.76 |
Weighted Average Price to Sales Ratio | Upgrade |
Weighted Average Price to Book Ratio | Upgrade |
Weighted Median ROE | Upgrade |
Weighted Median ROA | Upgrade |
Forecasted Dividend Yield | Upgrade |
Forecasted PE Ratio | Upgrade |
Forecasted Price to Sales Ratio | Upgrade |
Forecasted Price to Book Ratio | Upgrade |
As of March 29, 2023
Fund Details
Key Dates | |
Inception Date | 4/30/2019 |
Last Annual Report Date | 12/31/2022 |
Last Prospectus Date | 4/30/2022 |
Attributes | |
Index Fund |
|
Inverse Fund | No |
Leveraged Fund | No |
Fund of Funds | No |
Currency Hedged Fund | No |
Synthetic Replication Fund | No |
Has Dividend Investment Plan | No |
Socially Responsible Fund | No |
News
Headline
Wire
Time (ET)