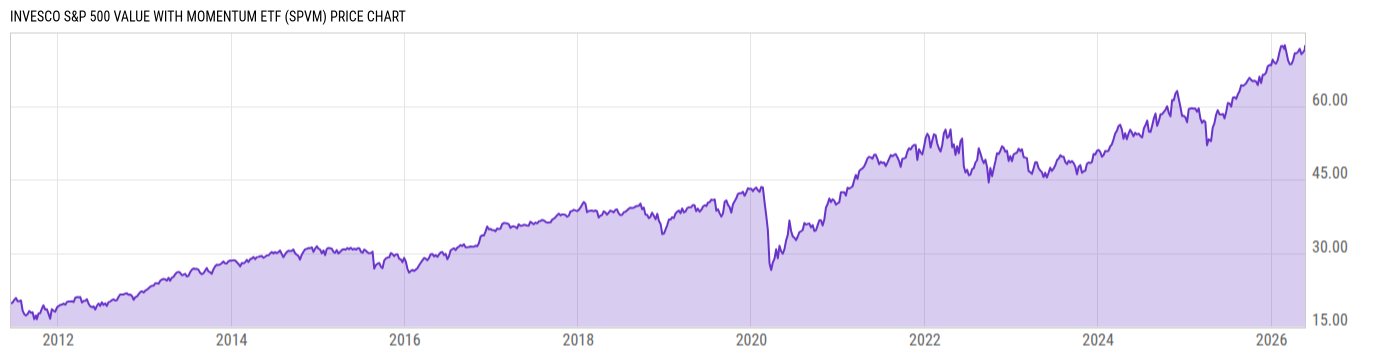
Invesco S&P 500 Value with Momentum ETF (SPVM)
42.94
-0.96 (-2.20%)
USD |
Feb 25, 20:00
Price Chart
Key Stats
Customize
Expense Ratio | Discount or Premium to NAV | Total Assets Under Management | 30-Day Average Daily Volume |
---|---|---|---|
0.39% | 0.03% | 23.61M | 17969.17 |
Dividend Yield | Turnover Ratio | 1 Year Fund Level Flows | Max Drawdown (All) |
2.00% | 127.0% | -29.80M | Upgrade |
Basic Info
Investment Strategy | |
The investment seeks to track the investment results (before fees and expenses) of the S&P 500® High Momentum Value Index (the "underlying index"). The fund generally will invest at least 90% of its total assets in the securities that comprise the underlying index. Strictly in accordance with its guidelines and mandated procedures, the index provider compiles, maintains and calculates the underlying index, which is designed to track the performance of approximately 100 stocks in the S&P 500® Index that have the highest "value" and "momentum" scores. |
General | |
Security Type | Exchange-Traded Fund |
Equity Style | Mid Cap/Value |
Fixed Income Style | -- |
Broad Asset Class | US Equity |
Broad Category | Equity |
Category Name | Large Value |
Category Index | Russell 1000 Value TR USD |
Prospectus Objective | Growth |
Fund Owner Firm Name | Invesco |
Prospectus Benchmark Index | |
S&P 500 High Momentum Value TR USD | 100.0% |
Broad Asset Class Benchmark Index | |
^SPXTR | 100.0% |
Manager Tenure | |
Michael Jeanette | 9.64 yrs |
Peter Hubbard | 9.64 yrs |
Tony Seisser | 6.43 yrs |
Pratik Doshi | 0.43 yrs |
Net Fund Flows Versus Category
1 Month
% Rank:
--
--
Category Low
--
Category High
1 Year
% Rank:
50
-29.80M
-7.280B
Category Low
6.666B
Category High
3 Months
% Rank:
--
--
Category Low
--
Category High
3 Years
% Rank:
--
--
Category Low
--
Category High
6 Months
% Rank:
--
--
Category Low
--
Category High
5 Years
% Rank:
--
--
Category Low
--
Category High
YTD
% Rank:
--
--
Category Low
--
Category High
10 Years
% Rank:
--
--
Category Low
--
Category High
As of January 31, 2021
Performance Versus Category
As of February 25, 2021. Returns for periods of 1 year and above are annualized.
Annual Total Returns Versus Peers
Edit comparables
As of February 25, 2021.
Asset Allocation
Top 10 Holdings
Name | % Weight | Price | % Change |
---|---|---|---|
MetLife Inc | 2.36% | 58.28 | 0.03% |
Ford Motor Co | 2.30% | 11.86 | 0.85% |
CVS Health Corp | 1.85% | 68.67 | -0.95% |
Archer-Daniels Midland Co | 1.82% | 57.39 | 0.07% |
The Kroger Co | 1.80% | 32.45 | 0.12% |
Centene Corp | 1.71% | 58.62 | -0.24% |
General Motors Co | 1.67% | 51.43 | 1.64% |
Capital One Financial Corp | 1.61% | 120.17 | 0.78% |
McKesson Corp | 1.56% | 170.65 | -1.99% |
Goldman Sachs Group Inc | 1.56% | 322.80 | -1.51% |
News
Headline
Wire
Time (ET)
PR Newswire
05/26 14:00
Basic Info
Investment Strategy | |
The investment seeks to track the investment results (before fees and expenses) of the S&P 500® High Momentum Value Index (the "underlying index"). The fund generally will invest at least 90% of its total assets in the securities that comprise the underlying index. Strictly in accordance with its guidelines and mandated procedures, the index provider compiles, maintains and calculates the underlying index, which is designed to track the performance of approximately 100 stocks in the S&P 500® Index that have the highest "value" and "momentum" scores. |
General | |
Security Type | Exchange-Traded Fund |
Equity Style | Mid Cap/Value |
Fixed Income Style | -- |
Broad Asset Class | US Equity |
Broad Category | Equity |
Category Name | Large Value |
Category Index | Russell 1000 Value TR USD |
Prospectus Objective | Growth |
Fund Owner Firm Name | Invesco |
Prospectus Benchmark Index | |
S&P 500 High Momentum Value TR USD | 100.0% |
Broad Asset Class Benchmark Index | |
^SPXTR | 100.0% |
Manager Tenure | |
Michael Jeanette | 9.64 yrs |
Peter Hubbard | 9.64 yrs |
Tony Seisser | 6.43 yrs |
Pratik Doshi | 0.43 yrs |
Fundamentals
General | |
Distribution Yield | Upgrade |
Dividend Yield TTM (2-25-21) | 2.00% |
30-Day SEC Yield (1-31-21) | Upgrade |
7-Day SEC Yield | -- |
Number of Holdings | Upgrade |
Stock | |
Weighted Average PE Ratio | 15.71 |
Weighted Average Price to Sales Ratio | Upgrade |
Weighted Average Price to Book Ratio | Upgrade |
Weighted Median ROE | Upgrade |
Weighted Median ROA | Upgrade |
Forecasted Dividend Yield | Upgrade |
Forecasted PE Ratio | Upgrade |
Forecasted Price to Sales Ratio | Upgrade |
Forecasted Price to Book Ratio | Upgrade |
As of February 24, 2021
Growth Estimates
Fund Details
Key Dates | |
Inception Date | 6/16/2011 |
Last Annual Report Date | 4/30/2020 |
Last Prospectus Date | 8/28/2020 |
Attributes | |
Enhanced Index Fund | No |
Index Fund |
|
Inverse Fund | No |
Leveraged Fund | No |
Fund of Funds | No |
Currency Hedged Fund | No |
Synthetic Replication Fund | No |
Has Dividend Investment Plan | No |
Socially Responsible Fund | No |
News
Headline
Wire
Time (ET)
PR Newswire
05/26 14:00