

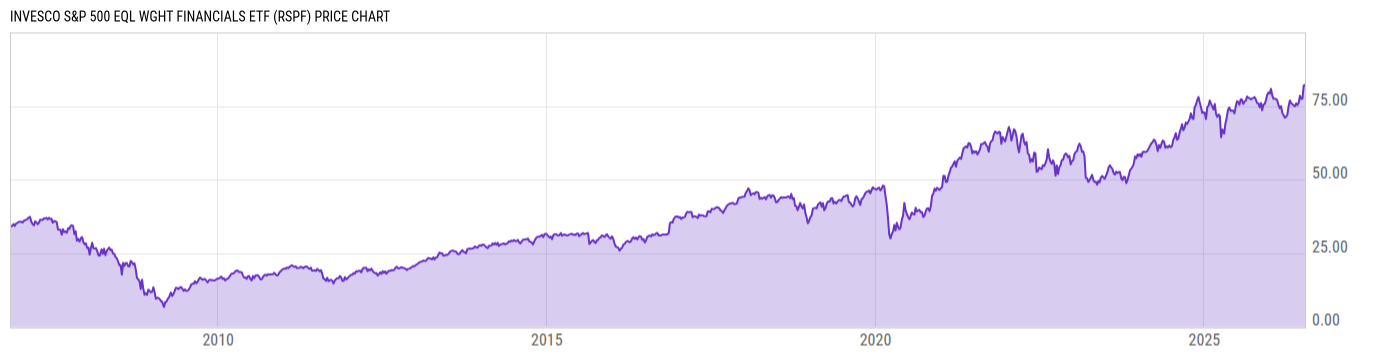
Invesco S&P 500 Eql Wght Financials ETF (RSPF)
82.01
-0.11
(-0.13%)
USD |
NYSEARCA |
Jul 14, 16:00
82.01
0.00 (0.00%)
After-Hours: 20:00
Price Chart
Key Stats
| Net Expense Ratio | Discount or Premium to NAV | Total Assets Under Management | 30-Day Average Daily Volume |
|---|---|---|---|
| 0.40% | -0.00% | 303.02M | 24812.33 |
| Weighted Average Dividend Yield | Turnover Ratio (Generic) | 1 Year Fund Level Flows | Max Drawdown (Since Inception) |
| 1.88% | 19.00% | -40.13M |
Basic Info
| Investment Strategy | |
| The Fund seeks to track the investment results of the S&P 500 Equal Weight Financials Index (the "Underlying Index"). The Fund, under normal circumstances, invests at least 90% of its total assets in the securities that comprise the Underlying Index. The Index is an equal-weighted version of the S&P 500 Financials Index. |
| General | |
| Security Type | Exchange-Traded Fund |
| Equity Style | Multi Cap Value |
| Broad Asset Class | Sector Equity |
| Broad Category | Equity |
| Global Peer Group | Equity Sector Financials |
| Peer Group | Financial Services Funds |
| Global Macro | Equity Industry Sector |
| US Macro | Sector Equity Funds |
| YCharts Categorization | -- |
| YCharts Benchmark | -- |
| Prospectus Objective | Financial Services Funds |
| Fund Owner Firm Name | Invesco |
| Broad Asset Class Benchmark Index | |
| ^MSWNTR | 100.0% |
Performance Versus Peer Group
Annual Total Returns Versus Peers
As of July 14, 2026.
Asset Allocation
As of June 30, 2026.
| Type | % Net |
|---|---|
| Cash | -0.08% |
| Stock | 100.1% |
| Bond | 0.00% |
| Convertible | 0.00% |
| Preferred | 0.00% |
| Other | 0.00% |
Basic Info
| Investment Strategy | |
| The Fund seeks to track the investment results of the S&P 500 Equal Weight Financials Index (the "Underlying Index"). The Fund, under normal circumstances, invests at least 90% of its total assets in the securities that comprise the Underlying Index. The Index is an equal-weighted version of the S&P 500 Financials Index. |
| General | |
| Security Type | Exchange-Traded Fund |
| Equity Style | Multi Cap Value |
| Broad Asset Class | Sector Equity |
| Broad Category | Equity |
| Global Peer Group | Equity Sector Financials |
| Peer Group | Financial Services Funds |
| Global Macro | Equity Industry Sector |
| US Macro | Sector Equity Funds |
| YCharts Categorization | -- |
| YCharts Benchmark | -- |
| Prospectus Objective | Financial Services Funds |
| Fund Owner Firm Name | Invesco |
| Broad Asset Class Benchmark Index | |
| ^MSWNTR | 100.0% |