

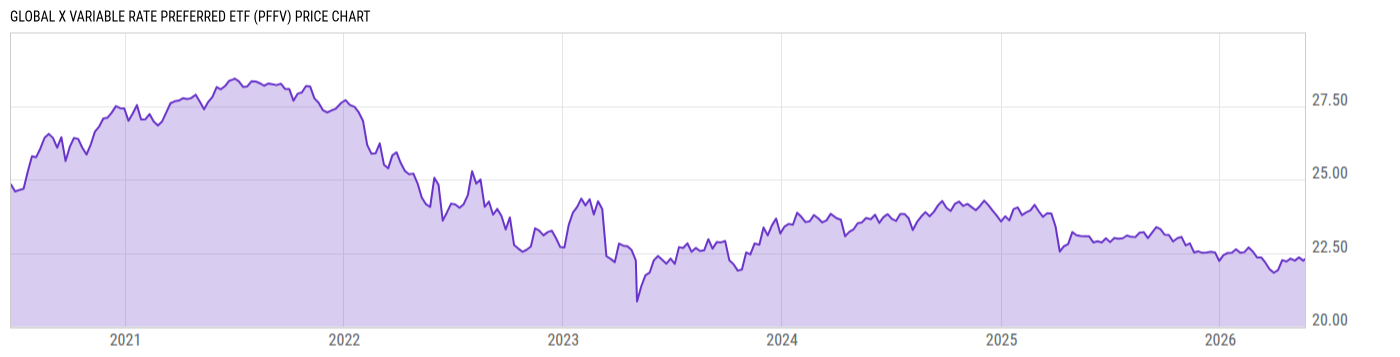
Global X Variable Rate Preferred ETF (PFFV)
22.29
-0.01
(-0.04%)
USD |
NYSEARCA |
May 22, 16:00
22.28
-0.01
(-0.04%)
After-Hours: 20:00
Price Chart
Key Stats
| Net Expense Ratio | Discount or Premium to NAV | Total Assets Under Management | 30-Day Average Daily Volume |
|---|---|---|---|
| 0.25% | 0.04% | 305.42M | 58119.47 |
| Weighted Average Dividend Yield | Turnover Ratio (Generic) | 1 Year Fund Level Flows | Max Drawdown (Since Inception) |
| -- | 57.00% | -12.74M |
Basic Info
| Investment Strategy | |
| The Fund seeks to provide investment results that correspond generally to the price and yield performance, before fees and expenses, of the ICE US Variable Rate Preferred Securities Index. The Underlying Index is designed to track the broad-based performance of the US listed variable rate preferred securities market. |
| General | |
| Security Type | Exchange-Traded Fund |
| Equity Style | -- |
| Broad Asset Class | US Equity |
| Broad Category | Equity |
| Global Peer Group | Equity US Income |
| Peer Group | Equity Income Funds |
| Global Macro | Equity North America |
| US Macro | Equity Income Funds |
| YCharts Categorization | -- |
| YCharts Benchmark | -- |
| Prospectus Objective | Equity Income Funds |
| Fund Owner Firm Name | Global X |
| Broad Asset Class Benchmark Index | |
| ^SPXTR | 100.0% |
Performance Versus Peer Group
Annual Total Returns Versus Peers
As of May 26, 2026.
Asset Allocation
As of April 30, 2026.
| Type | % Net |
|---|---|
| Cash | 0.12% |
| Stock | 25.34% |
| Bond | 6.09% |
| Convertible | 0.00% |
| Preferred | 59.14% |
| Other | 9.30% |
Basic Info
| Investment Strategy | |
| The Fund seeks to provide investment results that correspond generally to the price and yield performance, before fees and expenses, of the ICE US Variable Rate Preferred Securities Index. The Underlying Index is designed to track the broad-based performance of the US listed variable rate preferred securities market. |
| General | |
| Security Type | Exchange-Traded Fund |
| Equity Style | -- |
| Broad Asset Class | US Equity |
| Broad Category | Equity |
| Global Peer Group | Equity US Income |
| Peer Group | Equity Income Funds |
| Global Macro | Equity North America |
| US Macro | Equity Income Funds |
| YCharts Categorization | -- |
| YCharts Benchmark | -- |
| Prospectus Objective | Equity Income Funds |
| Fund Owner Firm Name | Global X |
| Broad Asset Class Benchmark Index | |
| ^SPXTR | 100.0% |