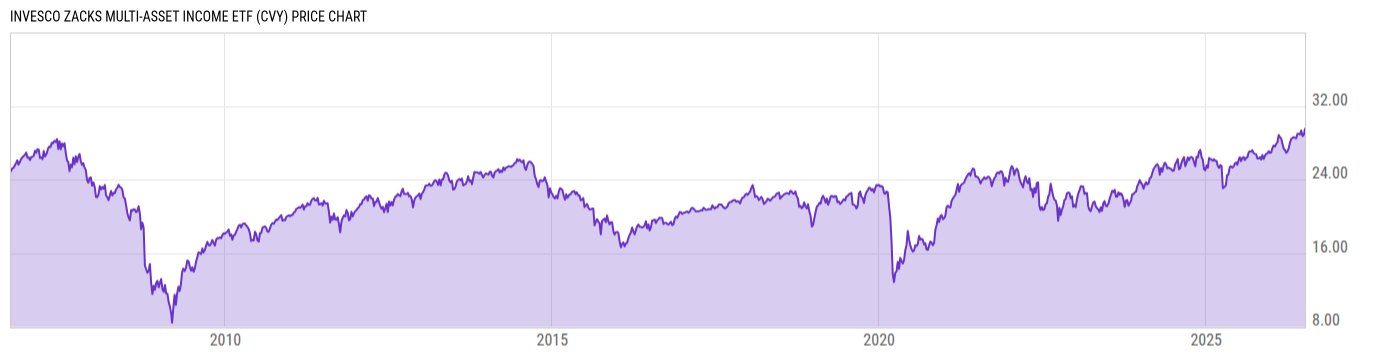
Key Stats

Expense Ratio Discount or Premium to NAV Total Assets Under Management 30-Day Average Daily Volume
0.89% -0.24% 96.35M 7219.83
Dividend Yield Turnover Ratio 1 Year Fund Level Flows Max Drawdown (All)
5.67% 161.0% -12.19M Upgrade

Basic Info

Investment Strategy
The investment seeks to track the investment results (before fees and expenses) of the Zacks Multi-Asset Income Index (the "underlying index"). The fund generally will invest at least 90% of its total assets in the securities that comprise the underlying index, as well as American depositary receipts ("ADRs") that represent securities in the underlying index. The underlying index is composed of securities that Zacks selects from a universe of domestic and international companies listed on major U.S. exchanges.
General
Security Type Exchange-Traded Fund
Equity Style Mid Cap/Value
Fixed Income Style Low Quality/Limited Sensitivity
Broad Asset Class Allocation
Broad Category Allocation
Category Name Allocation--85%+ Equity
Category Index Morningstar Agg Tgt Risk TR USD
Global Category Name Aggressive Allocation
YCharts Categorization Target Allocation
YCharts Benchmark S&P Target Risk Moderate Index (^STRB)
Prospectus Objective Multi-Asset Global
Fund Owner Firm Name Invesco
Prospectus Benchmark Index
Zacks Multi-Asset Income TR USD 100.0%
Broad Asset Class Benchmark Index
^SPXTR 100.0%
Manager Tenure
Michael Jeanette 4.90 yrs
Peter Hubbard 4.90 yrs
Tony Seisser 4.90 yrs
Pratik Doshi 2.51 yrs

Net Fund Flows Versus Category

View Net Fund Flows. Upgrade now.
1M
3M
6M
YTD
1Y
3Y
5Y
10Y
 
80.00B
60.00B
40.00B
20.00B
0
-20.00B
1 Month
% Rank: --
-- Category Low
-- Category High
1 Year
% Rank: 58
-12.19M
-898.97M Category Low
599.59M Category High
3 Months
% Rank: --
-- Category Low
-- Category High
3 Years
% Rank: --
-- Category Low
-- Category High
6 Months
% Rank: --
-- Category Low
-- Category High
5 Years
% Rank: --
-- Category Low
-- Category High
YTD
% Rank: --
-- Category Low
-- Category High
10 Years
% Rank: --
-- Category Low
-- Category High
As of February 28, 2023

Performance Versus Category

 
20%
15%
10%
5%
0
View Category Returns. Upgrade now.
Name
1M
3M
YTD
1Y
3Y
5Y
10Y
15Y
Total Return (Price)
--
--
--
--
--
--
--
--
Total Return (NAV)
--
--
--
--
--
--
--
--
Category Rtn. (NAV)
--
--
--
--
--
--
--
--
% Rank in Cat (NAV)
--
--
--
--
--
--
--
--
As of March 31, 2023. Returns for periods of 1 year and above are annualized.

Annual Total Returns Versus Peers

Loading chart...
Name
2016
2017
2018
2019
2020
2021
2022
YTD
16.28%
15.90%
-10.76%
25.97%
-10.46%
25.33%
-9.29%
1.00%
11.96%
21.83%
-4.38%
31.49%
18.40%
28.71%
-18.11%
7.50%
21.20%
6.32%
-9.28%
23.72%
-11.51%
22.67%
-13.51%
0.93%
16.69%
10.81%
-6.23%
21.44%
-12.81%
23.09%
-11.90%
4.20%
11.20%
5.61%
-5.77%
18.57%
-14.88%
16.49%
-3.87%
-0.29%
15.77%
4.33%
-9.98%
15.54%
-11.11%
18.03%
-7.73%
0.96%
As of March 31, 2023.

Fundamentals

General
Distribution Yield Upgrade
Dividend Yield TTM (3-31-23) 5.67%
30-Day SEC Yield (3-27-23) Upgrade
7-Day SEC Yield --
Number of Holdings Upgrade
Stock
Weighted Average PE Ratio 7.176
Weighted Average Price to Sales Ratio Upgrade
Weighted Average Price to Book Ratio Upgrade
Weighted Median ROE Upgrade
Weighted Median ROA Upgrade
Forecasted Dividend Yield Upgrade
Forecasted PE Ratio Upgrade
Forecasted Price to Sales Ratio Upgrade
Forecasted Price to Book Ratio Upgrade
Bond
Current Yield 6.80%
Yield to Maturity Upgrade
Effective Duration Upgrade
Average Coupon Upgrade
Average Credit Score Upgrade
Average Price --
As of March 29, 2023

Fund Details

Key Dates
Inception Date 9/21/2006
Last Annual Report Date 4/30/2022
Last Prospectus Date 8/26/2022
Attributes
Index Fund Yes
Inverse Fund No
Leveraged Fund No
Fund of Funds No
Currency Hedged Fund No
Synthetic Replication Fund No
Has Dividend Investment Plan No
Socially Responsible Fund No

Asset Allocation

As of March 29, 2023.
Type % Net % Long % Short
Cash -1.22% Upgrade Upgrade
Stock 80.45% Upgrade Upgrade
Bond 9.38% Upgrade Upgrade
Convertible 0.06% Upgrade Upgrade
Preferred 10.94% Upgrade Upgrade
Other 0.39% Upgrade Upgrade

Top 10 Holdings

Name % Weight Price % Change
Alliance Resource Partners LP 1.31% 20.17 -0.49%
Black Stone Minerals LP Partnership Units 1.26% 15.69 1.55%
The Kroger Co 1.21% 49.37 0.63%
JPMorgan Chase & Co 6% PRF PERPETUAL USD 25 - Dep rep 1/400 Ser EE
1.18% -- --
Marathon Petroleum Corp 1.15% 134.83 0.66%
Bank of America Corp 7 1/4 % Non-Cum Perp Conv Pfd Shs Series -L-
1.14% -- --
Wells Fargo & Co 4.75% PRF PERPETUAL USD 25 Series Z Class A
1.13% -- --
Wells Fargo & Co 7 1/2 % Non Cum Perp Conv Pfd Shs -A- Series -L-
1.12% -- --
Valero Energy Corp 1.12% 139.60 1.88%
DoubleLine Income Solutions 1.12% 11.37 0.80%

Basic Info

Investment Strategy
The investment seeks to track the investment results (before fees and expenses) of the Zacks Multi-Asset Income Index (the "underlying index"). The fund generally will invest at least 90% of its total assets in the securities that comprise the underlying index, as well as American depositary receipts ("ADRs") that represent securities in the underlying index. The underlying index is composed of securities that Zacks selects from a universe of domestic and international companies listed on major U.S. exchanges.
General
Security Type Exchange-Traded Fund
Equity Style Mid Cap/Value
Fixed Income Style Low Quality/Limited Sensitivity
Broad Asset Class Allocation
Broad Category Allocation
Category Name Allocation--85%+ Equity
Category Index Morningstar Agg Tgt Risk TR USD
Global Category Name Aggressive Allocation
YCharts Categorization Target Allocation
YCharts Benchmark S&P Target Risk Moderate Index (^STRB)
Prospectus Objective Multi-Asset Global
Fund Owner Firm Name Invesco
Prospectus Benchmark Index
Zacks Multi-Asset Income TR USD 100.0%
Broad Asset Class Benchmark Index
^SPXTR 100.0%
Manager Tenure
Michael Jeanette 4.90 yrs
Peter Hubbard 4.90 yrs
Tony Seisser 4.90 yrs
Pratik Doshi 2.51 yrs

Fundamentals

General
Distribution Yield Upgrade
Dividend Yield TTM (3-31-23) 5.67%
30-Day SEC Yield (3-27-23) Upgrade
7-Day SEC Yield --
Number of Holdings Upgrade
Stock
Weighted Average PE Ratio 7.176
Weighted Average Price to Sales Ratio Upgrade
Weighted Average Price to Book Ratio Upgrade
Weighted Median ROE Upgrade
Weighted Median ROA Upgrade
Forecasted Dividend Yield Upgrade
Forecasted PE Ratio Upgrade
Forecasted Price to Sales Ratio Upgrade
Forecasted Price to Book Ratio Upgrade
Bond
Current Yield 6.80%
Yield to Maturity Upgrade
Effective Duration Upgrade
Average Coupon Upgrade
Average Credit Score Upgrade
Average Price --
As of March 29, 2023

Fund Details

Key Dates
Inception Date 9/21/2006
Last Annual Report Date 4/30/2022
Last Prospectus Date 8/26/2022
Attributes
Index Fund Yes
Inverse Fund No
Leveraged Fund No
Fund of Funds No
Currency Hedged Fund No
Synthetic Replication Fund No
Has Dividend Investment Plan No
Socially Responsible Fund No

Top Portfolio Holders

0 of 0