

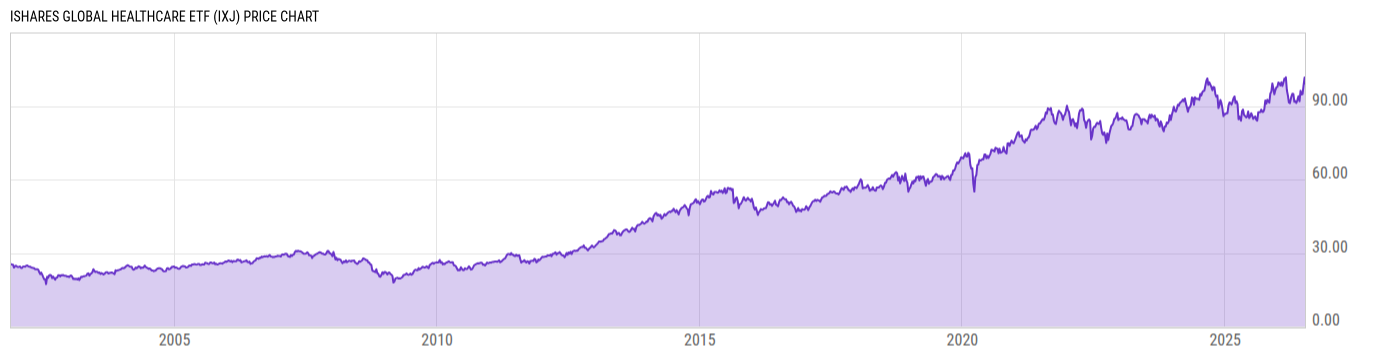
iShares Global Healthcare ETF (IXJ)
99.21
-0.73
(-0.73%)
USD |
NYSEARCA |
Jul 10, 16:00
99.34
+0.13
(+0.13%)
After-Hours: 20:00
Price Chart
Key Stats
| Net Expense Ratio | Discount or Premium to NAV | Total Assets Under Management | 30-Day Average Daily Volume |
|---|---|---|---|
| 0.38% | -0.06% | 4.080B | 365216.8 |
| Weighted Average Dividend Yield | Turnover Ratio (Generic) | 1 Year Fund Level Flows | Max Drawdown (Since Inception) |
| 1.67% | 2.00% | -515.83M |
Basic Info
| Investment Strategy | |
| The Fund seeks investment results that correspond generally to the price and yield performance, before fees and expenses, of companies that Standard & Poor's deems part of the healthcare sector of the economy and important to global markets, as represented by the S&P Global Healthcare Sector Index ("the Index"). The Index is a subset of the Standard & Poor's Global 1200 Index. |
| General | |
| Security Type | Exchange-Traded Fund |
| Equity Style | Large Cap Core |
| Broad Asset Class | Sector Equity |
| Broad Category | Equity |
| Global Peer Group | Equity Sector Healthcare |
| Peer Group | Global Health/Biotechnology Funds |
| Global Macro | Equity Industry Sector |
| US Macro | World Sector Equity Funds |
| YCharts Categorization | -- |
| YCharts Benchmark | -- |
| Prospectus Objective | Global Health/Biotechnology Funds |
| Fund Owner Firm Name | BlackRock |
| Broad Asset Class Benchmark Index | |
| ^MSWNTR | 100.0% |
Performance Versus Peer Group
Annual Total Returns Versus Peers
As of July 13, 2026.
Asset Allocation
As of June 30, 2026.
| Type | % Net |
|---|---|
| Cash | 0.20% |
| Stock | 99.48% |
| Bond | 0.08% |
| Convertible | 0.00% |
| Preferred | 0.09% |
| Other | 0.16% |
Basic Info
| Investment Strategy | |
| The Fund seeks investment results that correspond generally to the price and yield performance, before fees and expenses, of companies that Standard & Poor's deems part of the healthcare sector of the economy and important to global markets, as represented by the S&P Global Healthcare Sector Index ("the Index"). The Index is a subset of the Standard & Poor's Global 1200 Index. |
| General | |
| Security Type | Exchange-Traded Fund |
| Equity Style | Large Cap Core |
| Broad Asset Class | Sector Equity |
| Broad Category | Equity |
| Global Peer Group | Equity Sector Healthcare |
| Peer Group | Global Health/Biotechnology Funds |
| Global Macro | Equity Industry Sector |
| US Macro | World Sector Equity Funds |
| YCharts Categorization | -- |
| YCharts Benchmark | -- |
| Prospectus Objective | Global Health/Biotechnology Funds |
| Fund Owner Firm Name | BlackRock |
| Broad Asset Class Benchmark Index | |
| ^MSWNTR | 100.0% |