

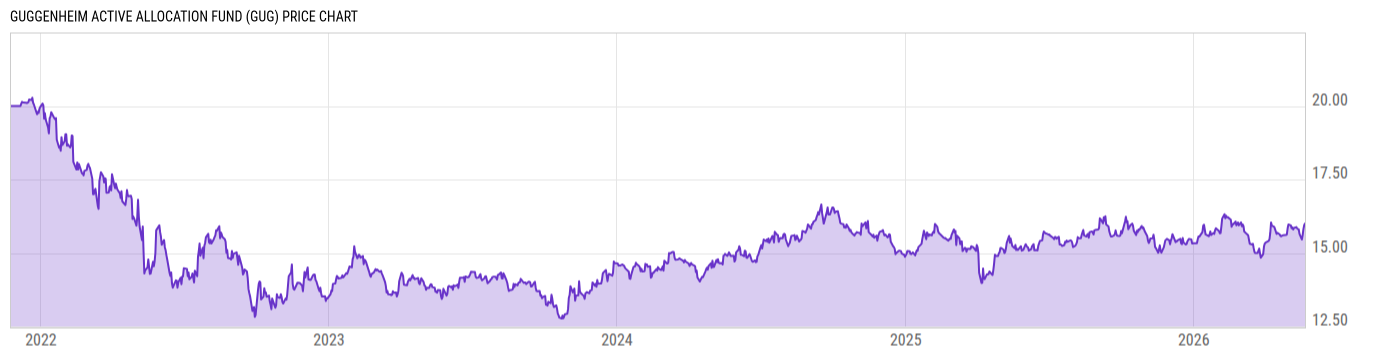
Guggenheim Active Allocation Fund (GUG)
16.00
+0.05
(+0.31%)
USD |
NYSE |
May 22, 16:00
15.99
-0.01
(-0.06%)
After-Hours: 20:00
Price Chart
Key Stats
| Net Expense Ratio | Discount or Premium to NAV | Total Assets Under Management | 30-Day Average Daily Volume |
|---|---|---|---|
| 3.83% | -3.15% | -- | 63653.77 |
| Weighted Average Dividend Yield | Turnover Ratio (Generic) | 1 Year Fund Level Flows | Max Drawdown (Since Inception) |
| -- | 25.00% | -- |
Basic Info
| Investment Strategy | |
| The Fund seeks total return through a combination of current income and capital appreciation. The Fund invests in a wide range of both fixed income and other debt instruments selected from a variety of sectors and credit qualities not limited to government, preferred and convertible securities, corporate bonds. |
| General | |
| Security Type | Closed-End Fund |
| Equity Style | -- |
| Broad Asset Class | Allocation |
| Broad Category | Allocation |
| Global Peer Group | Mixed Asset USD Conservative |
| Peer Group | Income & Preferred Stock Funds |
| Global Macro | Mixed Asset HC Conservative |
| US Macro | Mixed-Assets Target Allocation Funds |
| YCharts Categorization | -- |
| YCharts Benchmark | -- |
| Prospectus Objective | Income & Preferred Stock Funds |
| Fund Owner Firm Name | Guggenheim |
| Broad Asset Class Benchmark Index | |
| ^SPXTR | 100.0% |
Performance Versus Peer Group
Annual Total Returns Versus Peers
As of May 26, 2026.
Asset Allocation
As of November 30, 2025.
| Type | % Net |
|---|---|
| Cash | -0.15% |
| Stock | 3.37% |
| Bond | 126.8% |
| Convertible | 0.00% |
| Preferred | 1.86% |
| Other | -31.91% |
Basic Info
| Investment Strategy | |
| The Fund seeks total return through a combination of current income and capital appreciation. The Fund invests in a wide range of both fixed income and other debt instruments selected from a variety of sectors and credit qualities not limited to government, preferred and convertible securities, corporate bonds. |
| General | |
| Security Type | Closed-End Fund |
| Equity Style | -- |
| Broad Asset Class | Allocation |
| Broad Category | Allocation |
| Global Peer Group | Mixed Asset USD Conservative |
| Peer Group | Income & Preferred Stock Funds |
| Global Macro | Mixed Asset HC Conservative |
| US Macro | Mixed-Assets Target Allocation Funds |
| YCharts Categorization | -- |
| YCharts Benchmark | -- |
| Prospectus Objective | Income & Preferred Stock Funds |
| Fund Owner Firm Name | Guggenheim |
| Broad Asset Class Benchmark Index | |
| ^SPXTR | 100.0% |